On Friday, 23 October 2026, COMEX silver futures closed at $53.71 an ounce, their lowest close since November 2025. That is 53% below the record close of $115.08 set on 26 January. The same day, rising oil prices, hotter inflation data and a sell-off in tech stocks pushed silver below $54 for the first time this year, as traders priced in higher interest rates for longer.
So is now a good time to buy silver? US searches for that question peaked in January, when silver was at the top. Now it has halved, and the question is back. Both moments feel urgent, and both are hard to call.
The short answer: nobody can tell you if $53.71 is the bottom, and we will not try. What the data can tell you is that silver is cheaper than it was all year, that its past crashes took anywhere from 2 to 31 years to recover, and that a coin bought today has to rise about 19% before you break even. If you want silver, buying in stages beats betting everything on one day.
Whether now is a good time to buy silver depends on your time frame, not on the price. In late October 2026 silver traded near $54 an ounce, 53% below its January record and about 11% above its price a year earlier. The gold-silver ratio, at about 75 on 23 October, was only slightly above its median since 2000. Past silver crashes took 2.5, 14 and 31 years to recover in dollar terms, so a lower price is not proof of a bargain. Physical silver also starts behind: a Silver Eagle bought on 24 October needed a 19% rise to break even after dealer markups. For a long-term holder who sizes the position small and buys in stages, the drop lowers the entry cost. For anyone who needs the money within a few years, silver's swings remain the bigger risk.
This article does not evaluate silver as a long-term asset. For that, see silver's 55-year record against stocks, gold and inflation. Here we stick to timing: five signals, each dated, and what they can and cannot tell you.
Silver is at its lowest level of 2026 and about half its January peak. A drawdown is the fall from a peak to a later low, shown as a percentage. Silver's current drawdown is 53%.
Front-month COMEX futures settlements via Yahoo Finance. Spot prices quoted by dealers differ slightly.
Three numbers frame the drop. Silver is down 23% in 2026 so far. It is still 11% above where it traded a year ago, after a 2025 in which it more than doubled. And because losses and gains are not symmetric, a 53% fall needs a 114% rise to get back to even.
The speed matters too. On 30 January, four days after the record, silver closed at $78.29, a 31% fall in a single session. Our gold vs silver comparison shows that silver typically moves about twice as much as gold, in both directions. A price that halved in nine months can move another 20% in either direction in a few weeks.
The gold-silver ratio is how many ounces of silver one ounce of gold buys. On 23 October 2026, with COMEX gold at $4,007.90 and silver at $53.71, the ratio was 74.6.
Some dealers treat a high ratio as a buy signal for silver. Here is how today's level compares, measured on COMEX daily closes from August 2000 to October 2026:
So silver is cheaper relative to gold than it was in January, and a little cheaper than its 26-year middle. It is not at an extreme. J.P. Morgan's research team called a ratio near 70 still low historically in August and expected it to drift toward 75 in 2027.
The bigger caution is that the ratio has no fixed normal to return to. It describes which metal has done better, not which will do better next. We explain why in what the gold-silver ratio measures and what it predicts.
This is the most useful timing evidence, and the least comfortable. Silver has had four major crashes since 1980, including the current one. The three that have ended took between 2.5 years and three decades to recover in dollar terms, and the 1980 peak has never been regained after inflation.
1980 uses World Bank monthly averages, which smooth the extreme daily prices of that January. The other rows use COMEX daily closes via Yahoo Finance.
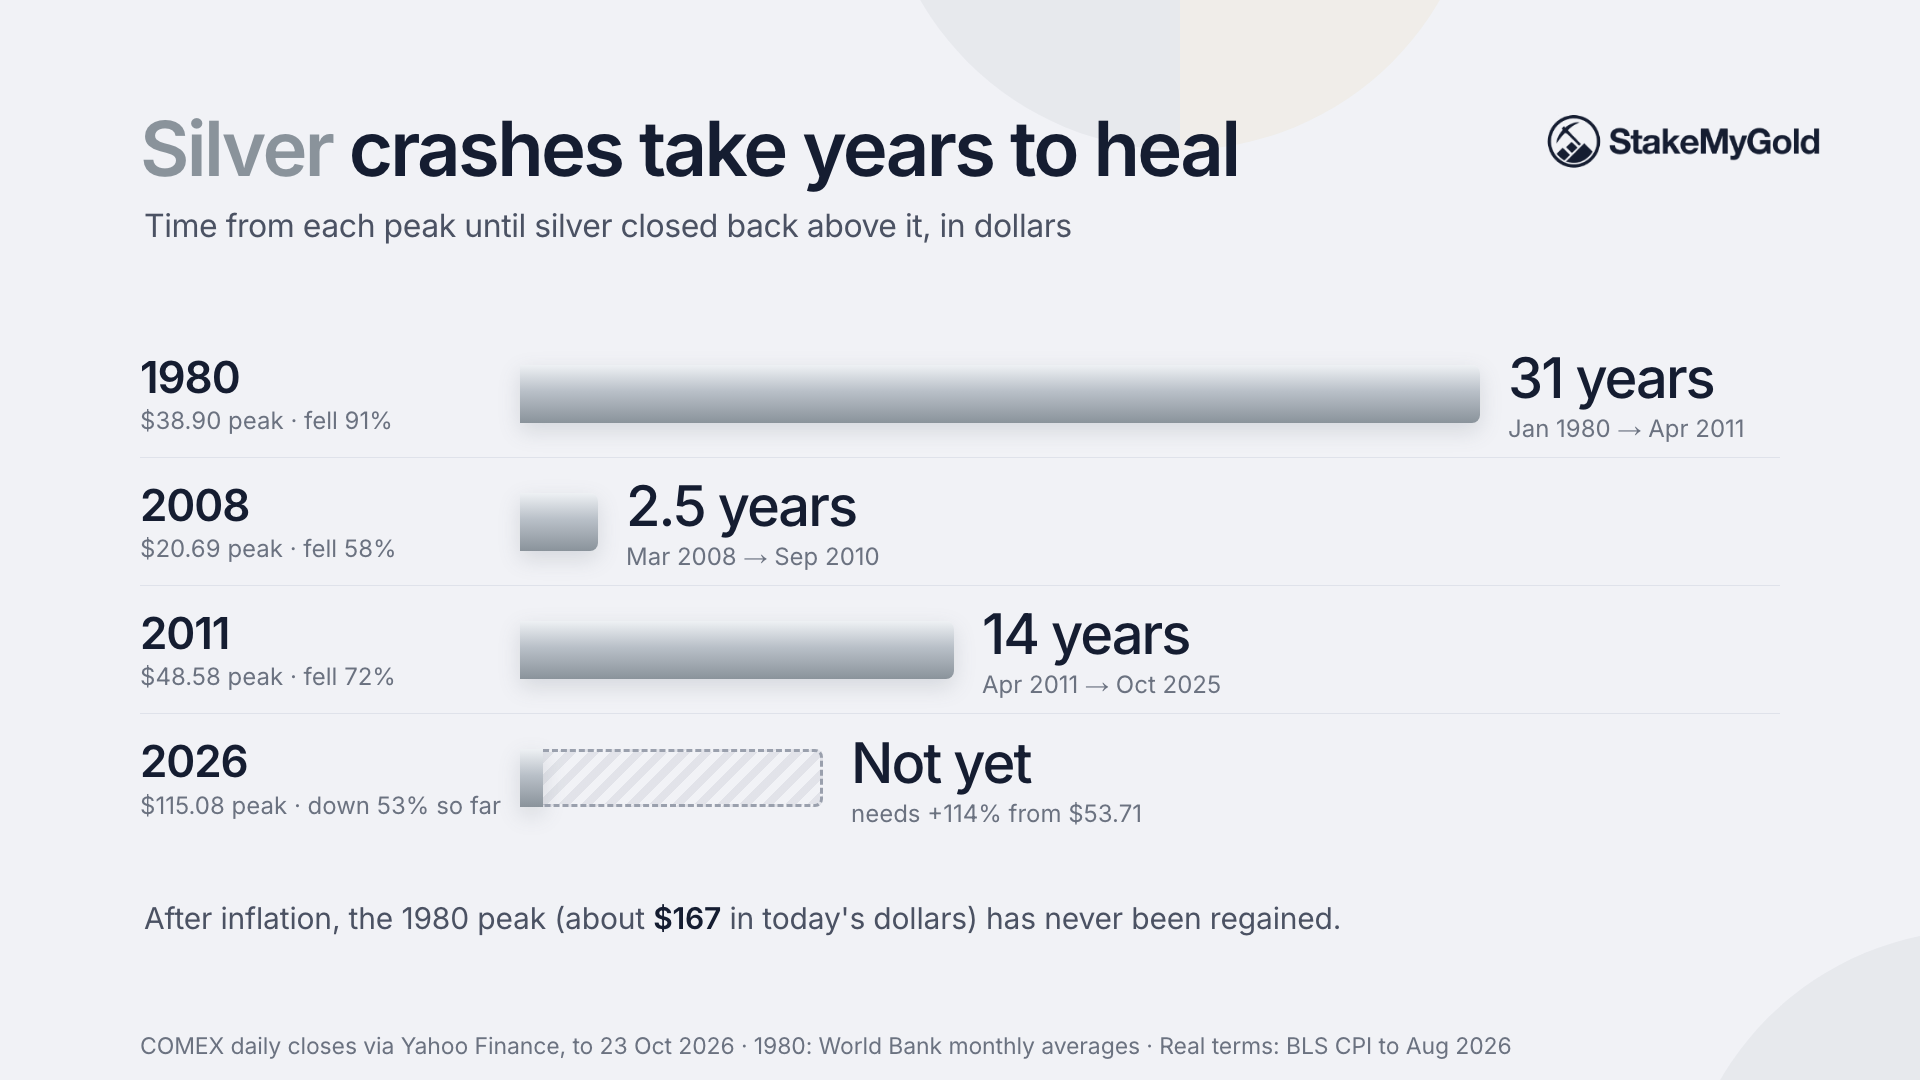
The 1980 peak came from the Hunt brothers' attempt to corner the market, which collapsed in the crash known as Silver Thursday on 27 March 1980. In real terms (after inflation), that peak has never been regained. Using the World Bank's monthly prices and the Bureau of Labor Statistics CPI, the January 1980 average equals about $167 in August 2026 dollars, three times today's price.
Two lessons follow. First, the shortest recovery followed the 2008 financial panic. The longest followed speculative peaks, when the price had run far ahead in a few months, as it did into January 2026. Second, the people who bought in the middle of each fall, not at the top, did far better. That is an argument for buying in pieces, which we come back to below.
Retail buyers never pay the spot price. They pay spot plus a premium, the dealer's markup for minting, shipping and profit. When they sell, they get less than spot. Here is one large US dealer's posted pricing on 24 October 2026:
| COMEX silver, closing price | Date | Price per ounce |
|---|
| Record close | 26 Jan 2026 | $115.08 |
| End of 2025 | 31 Dec 2025 | $70.13 |
| One year ago | 23 Oct 2025 | $48.48 |
| Latest close (2026 low) | 23 Oct 2026 | $53.71 |
| Crash | Peak | Fall | Back above the peak (dollars) |
|---|
| 1980 | Jan 1980 average, $38.90 | -91% by Mar 1993 | April 2011, 31 years later |
| 2008 | $20.69 close, 5 Mar 2008 | -58% by 28 Oct 2008 | 16 Sep 2010, about 2.5 years later |
| 2011 | $48.58 close, 29 Apr 2011 | -72% by 14 Dec 2015 | 8 Oct 2025, about 14 years later |
| 2026 | $115.08 close, 26 Jan 2026 | -53% so far (23 Oct 2026) | Not yet |
| Product | Dealer asks | Dealer pays you | Rise needed to break even |
|---|
| 1 oz American Silver Eagle | $59.23 (9% over spot) | $49.85 | about 19% |
| 10 oz silver bar | $560.20 ($56.02/oz, 3% over spot) | $468.46 ($46.85/oz) | about 20% |
Gainesville Coins, check or wire prices for the smallest quantity tier, with spot shown at $54.23 (ask) and $53.85 (bid). Card payments cost about 3.5% more.
Notice that the bar was cheaper to buy but no cheaper on a round trip, because the dealer paid much less for it. Either way, physical silver bought on 24 October needs a rise of about 19 to 20% before selling it returns your money. If you are buying for a quick rebound, that hurdle matters more than the timing.
Funds avoid most of that spread. The iShares Silver Trust charges a 0.50% yearly sponsor fee instead. In the US, both physical silver and physically backed silver funds are taxed as collectibles, at up to a 28% maximum rate on long-term gains. Our guide to six ways to invest in silver compares the options in full.
Professional forecasts sit above today's price, but they disagree widely and can be cut quickly. We include only calls tied to a named firm and a date:
Silver at $53.71 is already below J.P. Morgan's fourth-quarter figure, made only ten weeks earlier. That is the problem with forecasts as a timing tool: they move after the price does. For the full range of bank calls and our scenario math, see our silver price prediction for 2030. We do not make our own price prediction.
The near-term calendar is also busy. The Federal Reserve meets on 27 and 28 October, and on 23 October markets saw about a 10% chance of a rate hike at that meeting. Silver pays no interest, so higher rates tend to weigh on it. A single meeting can move the price by several percent either way.
No reliable one. Some dealer guides say silver is cheaper in the first half of the year. We checked COMEX daily closes from 2001 to 2025. The first-half average was below the second-half average in 15 of 25 years, or 60% of the time.
That edge is small, and it mostly reflects years when silver was rising, when any earlier month looks cheaper. It did nothing for 2026 buyers: January was the most expensive month of the year so far. Calendar patterns are a weak basis for a decision that silver's swings can swamp in a single week.
If you cannot know the bottom, the practical choice is between buying all at once and buying in stages. Dollar-cost averaging (DCA) means investing a fixed amount at regular intervals, whatever the price. You buy more ounces when silver is cheap and fewer when it is expensive.
Here is what happened to two buyers with $6,000 each in 2026, valued at the 23 October close of $53.71. Premiums and taxes are left out.
| All at once | Nine monthly buys | |
|---|---|---|
| When | 26 Jan 2026 close, $115.08 | $666.67 on the first trading day of each month, Feb to Oct |
| Ounces bought | 52.1 | 86.6 |
| Average cost per ounce | $115.08 | $69.25 |
| Value on 23 Oct 2026 | $2,800 (-53%) | $4,653 (-22%) |
Our calculation from COMEX closes via Yahoo Finance.
The monthly buyer still lost money, because silver kept falling. But the loss was less than half as large, and they now hold 66% more metal. DCA does not make silver go up. It limits how much one bad day can hurt you.
The trade-off cuts the other way too. If silver rises steadily from here, a lump sum bought today would beat a staged plan. Our 50-year test of dollar-cost averaging gold found lump sum and DCA each won about half the time once waiting cash earned interest. DCA's real value is behavioral: it keeps a drop right after you buy from scaring you into selling at the bottom.
To set up DCA in silver:
This is general information, not a recommendation for your situation.
Buying in stages now may make sense if you:
Waiting or skipping silver may make sense if you:
None of these signals predicts the next move. The ratio, the drawdown and past recoveries describe where silver stands, not where it is going. Silver could fall well below $50 or rebound sharply within weeks.
Our own figures (the ratio, the recovery dates, the seasonality test and the worked example) use COMEX front-month daily closes from August 2000 to 23 October 2026, via Yahoo Finance. The dealer prices come from one dealer on one day. Premiums change daily and vary by product, quantity and payment method. The worked example uses futures closes, ignores premiums and taxes, and covers only nine months. The recovery table includes only four crashes, which is too few to estimate the odds of any recovery time.
StakeMyGold does not offer a silver product. It is a gold-only platform: holders of GGBR, a gold-backed token, can stake it to earn a return paid in gold. The site's FAQ says yields are not guaranteed and lists the risks, including smart contract, counterparty and liquidity risk.
If you decide to buy silver, you will need a dealer, a broker or a fund, not this platform. If the volatility above makes you lean toward gold for your metals allocation, staking is one way to earn a yield on gold you already hold. It does not remove gold's price risk and adds risks of its own, set out in is gold staking safe.
Is it a good day to buy silver today? No single day can be identified as a good one in advance. On 23 October 2026 silver closed at $53.71, its lowest close in 11 months. Spreading purchases over several months reduces the risk of picking a bad day.
Will silver go up again? Nobody knows when. Forecasters such as J.P. Morgan and Metals Focus expect 2027 averages between about $64 and $84, but J.P. Morgan cut its numbers in August, and silver is already below its fourth-quarter figure. After its 2011 peak, silver took 14 years to recover.
Can silver get back above $100? It closed at $115.08 on 26 January 2026, so it has been there. From $53.71 it would need to more than double. None of the dated forecasts we found expects that in 2027.
Should I buy gold or silver right now? They do different jobs. Silver swings about twice as much as gold and fell harder in recent stock crashes. Gold has been the steadier diversifier. Many investors who want both hold more gold than silver.
How much silver should I own? There is no official rule. A common approach is to size silver so that a 50% fall, which happened in 2026, would not change your plans. For most people that means a small slice of a diversified portfolio.
Is it better to buy silver coins or a silver ETF right now? On 24 October 2026, a Silver Eagle needed a 19% rise to break even after dealer markups. A silver ETF costs about 0.50% a year instead. Coins suit people who want metal in hand; funds suit small, regular purchases.
Silver is 53% below its January record and at its lowest close in 11 months. That makes it cheaper than at any point this year. It does not make it cheap: the gold-silver ratio is only a little above its long-run middle, and past crashes took years to heal.
If you want silver for the long term, the drop lowers your entry cost. Buy in stages, keep the position small, choose a low-cost way to hold it, and expect it to swing. If you need the money soon, timing silver is a bet, not a plan.
This article is for informational purposes only and is not financial advice.
