In 2025, COMEX silver futures rose 142%. On 26 January 2026 they set a record close of $115.08 an ounce. By 16 October they had closed at $56.99, about half that level and 19% below where the year began. In under ten months, silver investors saw a huge rally and then a fall of more than half from the top.
That is why the question keeps coming back: is silver a good investment, or just an exciting one? Most answers online come from dealers, and most of them say yes without showing the record. We went through 55 years of data instead. We compared silver with stocks, bonds, cash, gold and inflation, and checked how it behaved in the last three stock market crashes.
The short answer: silver has been a poor long-term investment and a good short-term trade. From 1971 to 2025 it returned 6.9% a year, or 2.9% a year after inflation, well behind stocks at 11.1%. Since 1981 it has only kept pace with inflation. It suits a small, deliberate slice of a portfolio held by someone who can sit through a 50% fall. It does not suit savings you need to protect.
Silver is a good investment only in a narrow sense. It has made big gains in short bursts, such as 1971-1980 and 2020-2025, and in normal years it moves mostly independently of stocks. Over long periods, though, it has grown money more slowly than stocks or gold and has not reliably beaten inflation. From 1971 to 2025, silver returned 6.9% a year against 11.1% for US stocks and 9.0% for gold. After inflation, it earned 2.9% a year over that span and about 0% a year from 1981 to 2025. It lost money in 25 of those 55 years and fell about 35% during both the 2008 and 2020 stock market crashes. For most investors, that makes silver a high-risk satellite holding, sized small, rather than a core investment or a safe haven.
The rest of this article shows the evidence for each part of that answer: long-run returns, the decades that made and broke silver investors, inflation, crashes, and what a small silver slice does to a portfolio. If you are mainly choosing between the two metals, our gold vs silver comparison covers volatility and costs in more depth.
Over the 55 years since the US cut the dollar's link to gold, silver earned less than every major asset except cash. In August 1971, the US stopped converting dollars into gold, and from then on gold and silver traded freely. That makes 1971 a fair starting line.
Stocks, bonds, bills and CPI from NYU Stern's annual returns dataset; gold and silver from World Bank monthly prices, December to December. Price returns only for the metals.
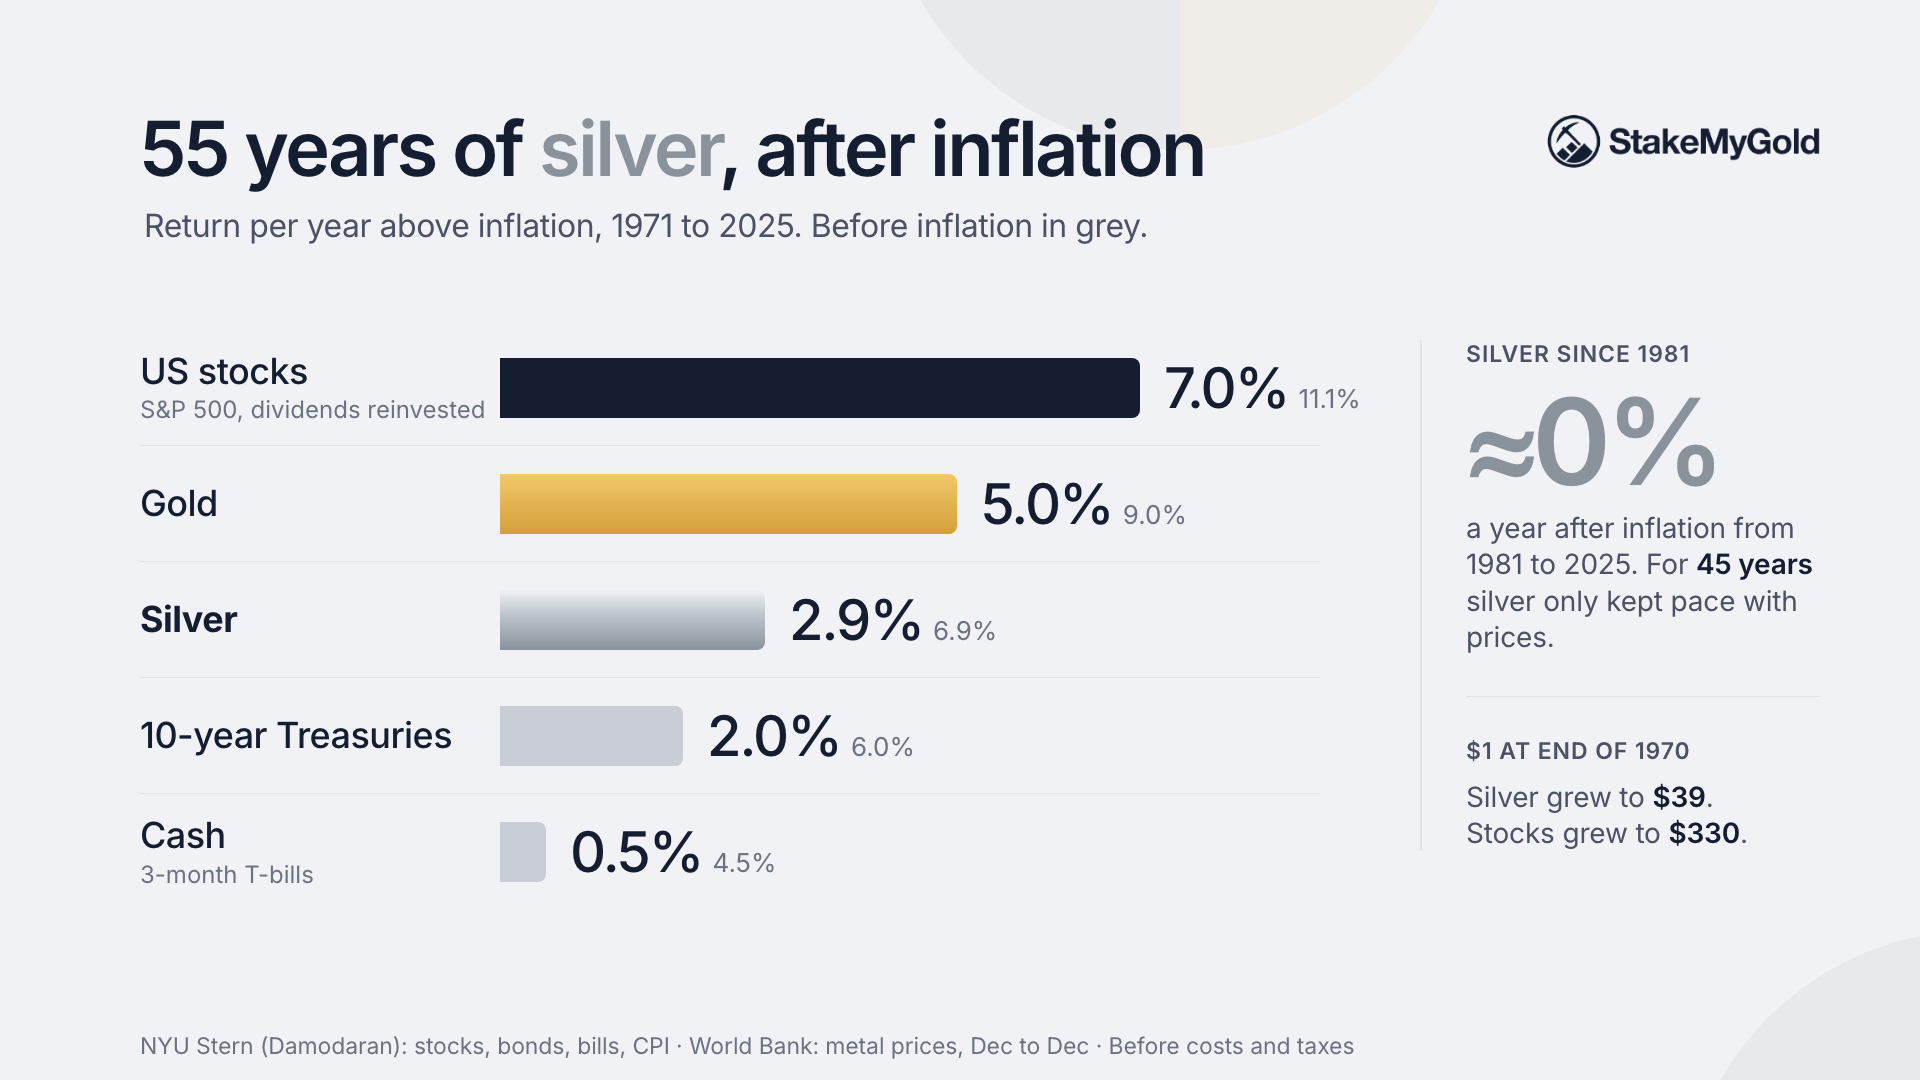

The stock and bond figures come from NYU Stern's historical returns dataset, maintained by Professor Aswath Damodaran. Silver and gold use the World Bank's monthly commodity prices.
In money terms, $1 in silver at the end of 1970 grew to about $39 by the end of 2025. The same dollar in the S&P 500, with dividends reinvested, grew to about $330.
Silver paid less than stocks and swung far more. Volatility is how widely an asset's returns spread around their average. Measured on yearly returns from 1971 to 2025:
| Asset, 1971-2025 | Return per year | After inflation, per year |
|---|
| US stocks (S&P 500, dividends reinvested) | 11.1% | 7.0% |
| Gold | 9.0% | 5.0% |
| Silver | 6.9% | 2.9% |
| 10-year US Treasury bonds | 6.0% | 2.0% |
| 3-month Treasury bills (cash) | 4.5% | 0.5% |
| Inflation (CPI) | 3.9% | n/a |
| 1971-2025 | Silver | Gold | Stocks | 10-year bonds |
|---|
| Volatility (std. dev. of yearly returns) | 46.6% | 26.0% | 16.9% | 9.7% |
| Losing years | 25 of 55 | 20 of 55 | 11 of 55 | 11 of 55 |
| Years that lost to inflation | 27 of 55 | 24 of 55 | 14 of 55 | 24 of 55 |
| Worst year | -49.1% (1981) | -27.5% (2013) | -36.6% (2008) | -17.8% (2022) |
| Best year | +281.4% (1979) | +118.8% (1979) | +37.2% (1995) | +32.8% (1982) |
Our calculation from the same NYU Stern and World Bank data.
Silver lost money in almost half of all years. It also had the best single year of any asset in the table. That combination is the core of the silver story: a few huge years carry the average.
Whether silver looks like a good long-term investment depends almost entirely on when you bought it. Its history splits into clear booms and long busts:
| Period | Silver per year | Silver after inflation | Stocks after inflation |
|---|---|---|---|
| 1971-1980 | 26.3% | 16.9% | 0.4% |
| 1981-2000 | -6.2% | -9.4% | 11.6% |
| 2001-2011 | 18.7% | 15.9% | -0.9% |
| 2012-2019 | -6.9% | -8.4% | 12.9% |
| 2020-2025 | 24.1% | 19.3% | 10.6% |
Our calculation, calendar years inclusive.
Silver did best when stocks did badly or when inflation was high, as in the 1970s and the 2000s. It did worst in the long stock booms of the 1980s and 1990s, and again from 2012 to 2019. Someone who bought at the end of 1980 lost 72% of their money in dollar terms over the next 20 years.
Rolling windows tell the same story without picking dates. We looked at every 10-year and 20-year stretch of calendar years from 1971 to 2025:
Holding silver for a long time does not reliably fix its problems. A decade is not long enough to be confident of beating inflation, and even 20 years is close to a coin toss.
Silver is an unreliable inflation hedge. An inflation hedge is an asset that holds or grows its buying power when prices rise. Silver has done that over some decades, but not year to year, and not over the past 45 years as a whole.
In the 11 years since 1971 when US inflation ran above 5%, silver beat inflation in only 5. Its average real return in those years looks high, at 15.5%. But that average rests on a single year, 1979, when silver rose 281%. The median year (the middle one when the 11 are sorted) was a loss of 2.7% after inflation. In 2021 and 2022, the most recent inflation spike, silver lost 15.9% and 2.7% after inflation.
Over long periods, the picture is mixed. From 1971 to 2025, silver beat inflation by 2.9% a year. From 1981 to 2025, it did not beat it at all. The difference is the 1970s boom. If protecting buying power is the goal, Treasury inflation-protected securities (TIPS) are built for that job. Silver is a bet on a specific kind of inflationary boom. For gold's own record against inflation, see is gold an inflation hedge.
No. In each of the last three big stock market falls, silver fell sharply as well, and much more than gold. We measured each metal's daily price over the exact dates when the S&P 500 fell from its peak to its low:
| Stock market fall | S&P 500 (with dividends) | Silver, start to end | Silver, worst point | Gold, start to end |
|---|---|---|---|---|
| Financial crisis, 9 Oct 2007 to 9 Mar 2009 | -55.3% | -3.9% | -34.8% | +24.5% |
| Covid crash, 19 Feb to 23 Mar 2020 | -33.8% | -27.7% | -35.8% | -2.5% |
| 2022 bear market, 3 Jan to 12 Oct 2022 | -24.5% | -17.2% | -23.0% | -6.8% |
COMEX front-month silver and gold, and the S&P 500 Total Return index, daily closes via Yahoo Finance.
Silver ended the 2007-2009 crash almost flat, but only after falling 35% in the autumn of 2008, the worst weeks for stocks. In 2020 it fell nearly as far as stocks. In 2022 it fell about two-thirds as much. Gold rose in the first crash and fell only a little in the other two.
The reason is demand. According to the Silver Institute's World Silver Survey 2026, industry used about 58% of the silver bought in 2025. When a crisis hits the economy, factory demand falls, and silver behaves like an industrial commodity.
Correlation measures how closely two assets move together, from -1 (always opposite) through 0 (unrelated) to +1 (always together). On yearly returns from 1971 to 2025, silver's correlation with stocks was 0.06, close to zero. On daily moves from 2000 to 2026 it was 0.12.
So in normal times silver moves mostly independently of stocks, which is useful in a portfolio. But a low average correlation hides the crashes, when silver tends to fall with everything else. Its correlation with gold, by contrast, was 0.83 on yearly returns: silver mostly moves like a more volatile version of gold.
In real terms, silver has never come back to its 1980 high. In January 1980, silver averaged $38.90 an ounce for the month, according to the World Bank data. In nominal dollars it did not average that much again until April 2011. Adjusted for US consumer prices from the Bureau of Labor Statistics CPI, $38.90 in January 1980 equals about $167 in August 2026 dollars.
Silver's best month since 1981, in those dollars, was January 2026, at about $95. Even at the top of the 2025-2026 rally, it was more than 40% below its 1980 level in real terms. In September 2026 it averaged $64.60, about 61% below.
This matters for anyone who hears that silver is "historically cheap" or "due to catch up." Silver has been below its 1980 real price for 46 years. A price that is low against a past peak can stay low for a lifetime.
Adding 10% silver to a classic stock and bond portfolio raised returns about as much as adding 10% gold, but without gold's main benefit: lower risk. We tested a 60/40 portfolio (60% stocks, 40% 10-year Treasuries), rebalanced every year, against versions that move 10% into silver or gold:
| 1971-2025, rebalanced yearly | 60/40 | 55/35 + 10% silver | 55/35 + 10% gold |
|---|---|---|---|
| Return per year | 9.50% | 9.84% | 9.82% |
| After inflation, per year | 5.40% | 5.73% | 5.71% |
| Volatility of yearly returns | 11.1% | 11.2% | 9.9% |
| 2008 | -13.9% | -15.9% | -12.9% |
| 2022 | -18.0% | -15.8% | -16.1% |
| $10,000 became | $1.47 million | $1.75 million | $1.73 million |
Our calculation. Before costs and taxes.
The silver slice added about a third of a percentage point a year, much of it from the 1970s. From 2000 to 2025 the result was similar: 7.60% a year with 10% silver against 6.94% for the plain 60/40.
But look at the risk rows. Gold cut the portfolio's volatility from 11.1% to 9.9% and softened 2008. Silver left volatility unchanged and made 2008 worse. If what you want from metals is protection, gold did that job better. If you want a small extra return driver, silver did that, at the cost of a rougher ride.
Every return in this article is before costs, and silver costs more to own than most assets. Three costs matter for a US buyer:
We put numbers on these costs for a $10,000 purchase in our gold vs silver comparison, and the tax rules are in how gold and silver are taxed.
Here is what happened to two buyers who each put $10,000 into silver near a peak, valued at the September 2026 average price of $64.60. Monthly average prices; costs and taxes left out.
| Bought January 1980 | Bought April 2011 | |
|---|---|---|
| Purchase price (monthly average) | $38.90 | $42.70 |
| Value in September 2026 | $16,607 | $15,129 |
| Value in today's buying power | $3,857 | $10,157 |
| Change in consumer prices over the period | x4.31 | x1.49 |
Our calculation from World Bank prices and BLS CPI.
The 1980 buyer has 66% more dollars after 46 years, but those dollars buy less than 40% of what the original $10,000 did. The 2011 buyer, who bought near the next peak, is roughly back to even in buying power after 15 years, and only because silver more than doubled in 2025.
Both buyers bought at a moment when silver was the story everyone was talking about. So did anyone who bought in January 2026.
This is general information, not a recommendation for your situation.
Silver may suit you if:
Silver probably does not suit you if:
How much is "small"? There is no official rule. Our guide to how much gold to own walks through sizing after a large fall, and the same logic applies, more strictly, to silver. To compare ways of holding it, see how to invest in silver.
Annual returns for US stocks (S&P 500 with dividends), 3-month Treasury bills, 10-year Treasury bonds and CPI inflation come from Damodaran's dataset at NYU Stern, data to the end of 2025. Silver and gold annual returns are the change in the December monthly average price from one year to the next, from the World Bank Pink Sheet (London prices, data to September 2026). Real returns divide by one plus that year's CPI inflation. Monthly real prices use the BLS CPI-U index to August 2026. Crash figures use daily COMEX front-month settlements and the S&P 500 Total Return index from Yahoo Finance. Portfolios rebalance once a year. The script (analysis.py) and output (results.json) are published with this article.
Monthly and December averages smooth out the most extreme prices, so peaks and troughs on any single day were more extreme than shown. The metal returns ignore premiums, storage, fund fees and taxes, which lower silver's real-world return further. Stock returns assume dividends were reinvested with no costs.
Most of all, history does not predict the next 10 years. Silver could enter another boom like the 1970s or 2020s. Industrial demand from solar panels and electronics could grow faster than expected, or thrifting could shrink it. If you want our scenarios, see our silver price prediction for 2030. This article only tells you how silver has behaved, not how it will.
StakeMyGold does not offer a silver product. It is a gold-only platform where holders of GGBR, a gold-backed token, can stake it to earn a return paid in gold. The site's FAQ states a target return that is not guaranteed and can change, and lists the risks, including smart contract and counterparty risk. GGBR is backed by certificates for gold still in the ground rather than vaulted bars, which we explain in what actually backs your token.
If you decide silver is right for you, this platform is not the place to buy it. If the data above makes you lean toward gold for the metals part of your portfolio, staking is one way to earn a yield on gold you already hold. It does not remove gold's price risk, and it adds risks of its own, set out in is gold staking safe.
Is silver a good long-term investment? Not on the record so far. From 1971 to 2025 silver returned 6.9% a year against 11.1% for stocks and 9.0% for gold. Since 1981 it has only matched inflation. Over 20-year periods it beat stocks only 17% of the time.
Is it smart to invest in silver right now? Nobody can tell you when silver will bottom. In mid-October 2026 it traded at about half its January record, which makes it cheaper than earlier in the year but not necessarily cheap. If you buy, size the position so another 50% fall would not hurt you, and consider buying in stages.
Is silver a good hedge against inflation? Only loosely. In the 11 high-inflation years since 1971, silver beat inflation in 5. It lost to inflation in both 2021 and 2022. It did well over the 1970s as a whole, but not over the 45 years since.
Can silver hit $100 an ounce? It already has. COMEX silver closed at a record $115.08 on 26 January 2026, before falling back below $60 by October. Whether it returns there depends on gold, industrial demand and investor flows; our silver price prediction for 2030 sets out scenarios.
Does silver go up when stocks crash? Usually not. Silver fell about 35% at its worst point in both the 2008 and 2020 crashes, and fell 17% in the 2022 bear market. Gold held up much better in all three.
How much of my portfolio should be in silver? There is no fixed rule. In our test, a 10% silver slice added a little return to a 60/40 portfolio but did not reduce risk. Size it so that a 50% fall in silver, which happened in 2026, would not change your plans.
Silver has been an exciting asset and a disappointing investment. Over 55 years it trailed stocks and gold, matched inflation since 1981, swung harder than anything else we measured and fell alongside stocks in the crashes that mattered. Its big gains came in a few short bursts that were hard to time and easy to buy at the top.
That does not make silver useless. A small slice, bought with eyes open and held through the swings, can add some return in a portfolio. Just don't buy it expecting it to protect you, to beat inflation on schedule or to get back to its 1980 peak.
This article is for informational purposes only and is not financial or tax advice.
