On 9 October 2026, COMEX gold futures settled at $4,216.30 an ounce and silver settled at $61.05. Both were far below their January records. Gold was about 21% under its closing high. Silver was about 47% under its own. Same year, same headlines, and a very different gold vs silver result.
That gap is the real question. Most comparisons stop at "silver is cheaper and more industrial." If you are deciding where to put money, you need to know how much more silver swings, how far it has fallen before, what it costs to hold, and whether it has paid you for the extra risk.
The short answer: silver has been about twice as volatile as gold since 2000, and more volatile in every single calendar year. It has not paid twice the return. Over 20 years, 25 years and since 1971, gold came out ahead. Silver won over 1, 5 and 10 years. Gold suits a core, lower-risk holding; silver suits a smaller position for investors who can sit through 50% drops.
Gold is the steadier, more liquid store of value. Silver is a cheaper, more volatile metal whose price depends far more on factories. The table puts the main differences side by side. Every figure is explained, with its source, further down.
Prices, volatility, falls and returns are our calculations from COMEX daily settlements and World Bank monthly data; method in "How we calculated this" below.
Silver is roughly twice as volatile as gold, and that has held in every calendar year since 2000. Volatility is a measure of how widely a price swings around its average. We measure it as the yearly standard deviation of daily price changes. An asset with 30% volatility will often move 30% up or down in a typical year.
Here is what the daily COMEX settlement data shows:
Annualized standard deviation of daily log returns, COMEX front-month settlements via Yahoo Finance.
The data shows three things. First, silver was more volatile than gold in all 25 calendar years from 2001 to 2025. The gap ranged from 1.2 times to 2.3 times. Second, the gap has widened. It was 1.9 times over the full period and 2.4 times in 2026. Third, 2026 was extreme for both metals. Gold's volatility this year is close to what silver's is in a normal year.
The single worst day shows the difference. On 30 January 2026, the day after both metals peaked, gold settled 10.8% lower and silver settled 31.3% lower.
The metals usually move in the same direction. The correlation of their daily moves since 2000 is 0.78. Correlation runs from -1 (always opposite) to +1 (always together). So silver is not a hedge for gold. It is closer to a leveraged version of it.
Silver's big declines have been roughly twice as deep as gold's, and they have lasted longer. A drawdown is the fall from a peak to the lowest point before a new peak. It is the number that tells you how much pain you would have had to sit through.
1980 rows use World Bank monthly averages, which smooth out the extreme daily prices of January 1980. Other rows use COMEX daily settlements.
Two rows matter most for a buyer. Silver bought at its 2011 high took 14 years to break even in dollar terms. Silver bought at the January 1980 average took 31 years. Gold's recoveries were long too, at 26 years after 1980 and nine years after 2011, but its falls on the way were much shallower.
The 2008 and 2020 rows also say something about crises. When stocks crashed, gold fell less than silver both times. Silver behaves like an industrial commodity when the economy is the worry. If you hold precious metals as crisis insurance, that is worth knowing; we look at sizing in how much gold you should own.
Silver swings more because most of it is bought by industry, while gold is bought mainly by investors, jewelers and central banks. Factory demand rises and falls with the economy and with technology choices. Monetary demand follows fear, interest rates and the dollar.
In 2025, total gold demand was 5,002 tonnes, according to the World Gold Council's full-year 2025 report. Investment took 2,175 tonnes, jewelry fabrication 1,638 tonnes and central banks 863 tonnes. Technology, mainly electronics, took 323 tonnes, about 6.5% of the total.
So about 94% of gold demand goes into investment, jewelry and central bank reserves, and much of it is held as a store of value. That is why gold reacts to interest rates and crises more than to factory orders. We break down the buyers in who actually buys gold.
Silver is the opposite. The Silver Institute's World Silver Survey 2026, published on 15 April 2026, puts total 2025 demand at 1.13 billion ounces. Industrial demand was 657.4 million ounces of that, about 58%. Silver is used in electronics, solar panels, brazing alloys and car electrics because it conducts electricity and heat better than any other metal.
Industrial demand is not one-way, though. It fell 3% in 2025. The Silver Institute says solar panel makers cut the amount of silver per panel faster, and switched to substitutes, because silver had become expensive. It expects industrial demand to fall another 3% in 2026, while coin and bar buying rises 18%. High prices push industry away. That is one reason silver rallies tend to fade.
Most silver is a by-product. The US Geological Survey's 2026 silver summary says silver is mainly obtained as a by-product of lead-zinc, copper and gold mines. A copper miner does not dig more because silver is up. So silver supply barely reacts to price, and price has to do all the adjusting. The same USGS report notes that silver was added to the US list of critical minerals in November 2025.
Gold has its own buyer of last resort. Central banks bought 863 tonnes in 2025. Silver has no buyer of that size: in the Silver Institute's 2025 figures, the demand is industry, jewelry, silverware and private investors.
The gold-silver ratio is the number of ounces of silver that one ounce of gold buys. On the 9 October 2026 settlements it was about 69. It has ranged from about 15 in January 1980 to above 100 in March 2020.
The ratio tells you which metal has been doing better, not which one will. We explain why in the gold-silver ratio: what it measures and what it predicts, so we will not repeat it here.
Over long periods gold has returned slightly more than silver with about half the volatility. Over shorter periods the winner depends on the start date. The table uses COMEX settlements to 9 October 2026, and World Bank monthly averages for the longest periods.
Price returns only; neither metal pays income. Monthly rows run to the September 2026 average. Before costs and taxes.
What the table shows:
Now put the returns next to the volatility. Over 25 years, gold earned 11.3% a year with 18% volatility. Silver earned 11.0% with 33.5%. Per unit of risk, gold paid about twice as much. If you want our view of where silver could go next, see our silver price prediction for 2030.
Silver is more expensive to own than gold for the same dollar amount. It takes far more space, dealers charge a bigger markup, and vaults and funds charge more. This section prices those costs; for the ways to buy, see our guide on how to invest in silver.
At the 9 October 2026 prices, $10,000 buys 2.37 ounces of gold or 164 ounces of silver. That is about 74 grams of gold against 5.1 kilograms (11 pounds) of silver. Gold is also denser: the Royal Society of Chemistry lists gold at 19.3 grams per cubic centimeter and silver at 10.5. So the gold fits in about 3.8 cubic centimeters, and the silver needs about 485, around 127 times the space. A home safe that holds $500,000 of gold holds about $4,000 of silver.
Vaults charge more for silver for the same reason. BullionVault, for example, lists storage at 0.12% a year for gold and 0.48% for silver, with monthly minimums of $4 and $8 (checked 11 October 2026). On $10,000 the minimums apply: $48 a year for gold, $96 for silver. On $100,000 it is $120 against $480.
A premium is what a dealer charges above the spot price of the metal inside a coin or bar. On 11 October 2026, Gainesville Coins priced a 1 oz American Gold Eagle at $4,395.69, 4.5% over its gold spot price of $4,206.40, and a 1 oz American Silver Eagle at $66.13, 8.2% over silver spot of $61.13 (check or wire price, one coin). On $10,000, that is about $450 for gold and $820 for silver before you sell. Premiums move with demand and differ by dealer; card payments cost more. Our piece on gold coins vs bars explains what a premium buys you.
Funds avoid premiums and storage hassle, but charge yearly fees. The SPDR Gold Trust lists an expense ratio of 0.40%. The iShares Silver Trust lists a sponsor fee of 0.50%. On $10,000 that is $40 a year against $50.
For US investors, gold and silver are taxed the same way. The tax code defines a collectible to include "any metal or gem", and the IRS taxes long-term gains on collectibles at a maximum 28% rate. The 28% is a cap: if your ordinary rate is lower, you pay your ordinary rate.
Physically backed funds such as GLD and SLV are grantor trusts, so their shareholders are treated as owning the metal. That means gold and silver ETF owners face the same 28% top rate as bar owners. Inside an IRA, the same section of the code allows silver bullion as well as gold, if it meets the fineness rules and a trustee holds it.
So tax is not a reason to pick one metal over the other in the US. Rules differ in other countries. The details, including tokens, futures and the 3.8% surtax, are in how gold is taxed.
Gold is easier to trade in size. Liquidity means how easily you can buy or sell a large amount without moving the price. In June 2026, London's clearing system settled an average of $70.9 billion of gold a day against $12.9 billion of silver, according to the LBMA. Gold's market was about five times larger by value.
For a small investor both metals are easy to sell. The difference shows up in the spread, the gap between what a dealer charges you and what it pays you back. In percentage terms it is usually wider on silver, as the premiums above suggest, because silver is bulkier to handle, ship and store. Before you buy, ask what the dealer would pay you back that same day. We cover that in how to sell gold.
Here is what 2026 did to $10,000 in each metal, bought at the 31 December 2025 COMEX settlement (gold $4,341.10, silver $70.13). Costs and taxes are left out.
Our calculation from COMEX daily settlements. The 80/20 column assumes no rebalancing.
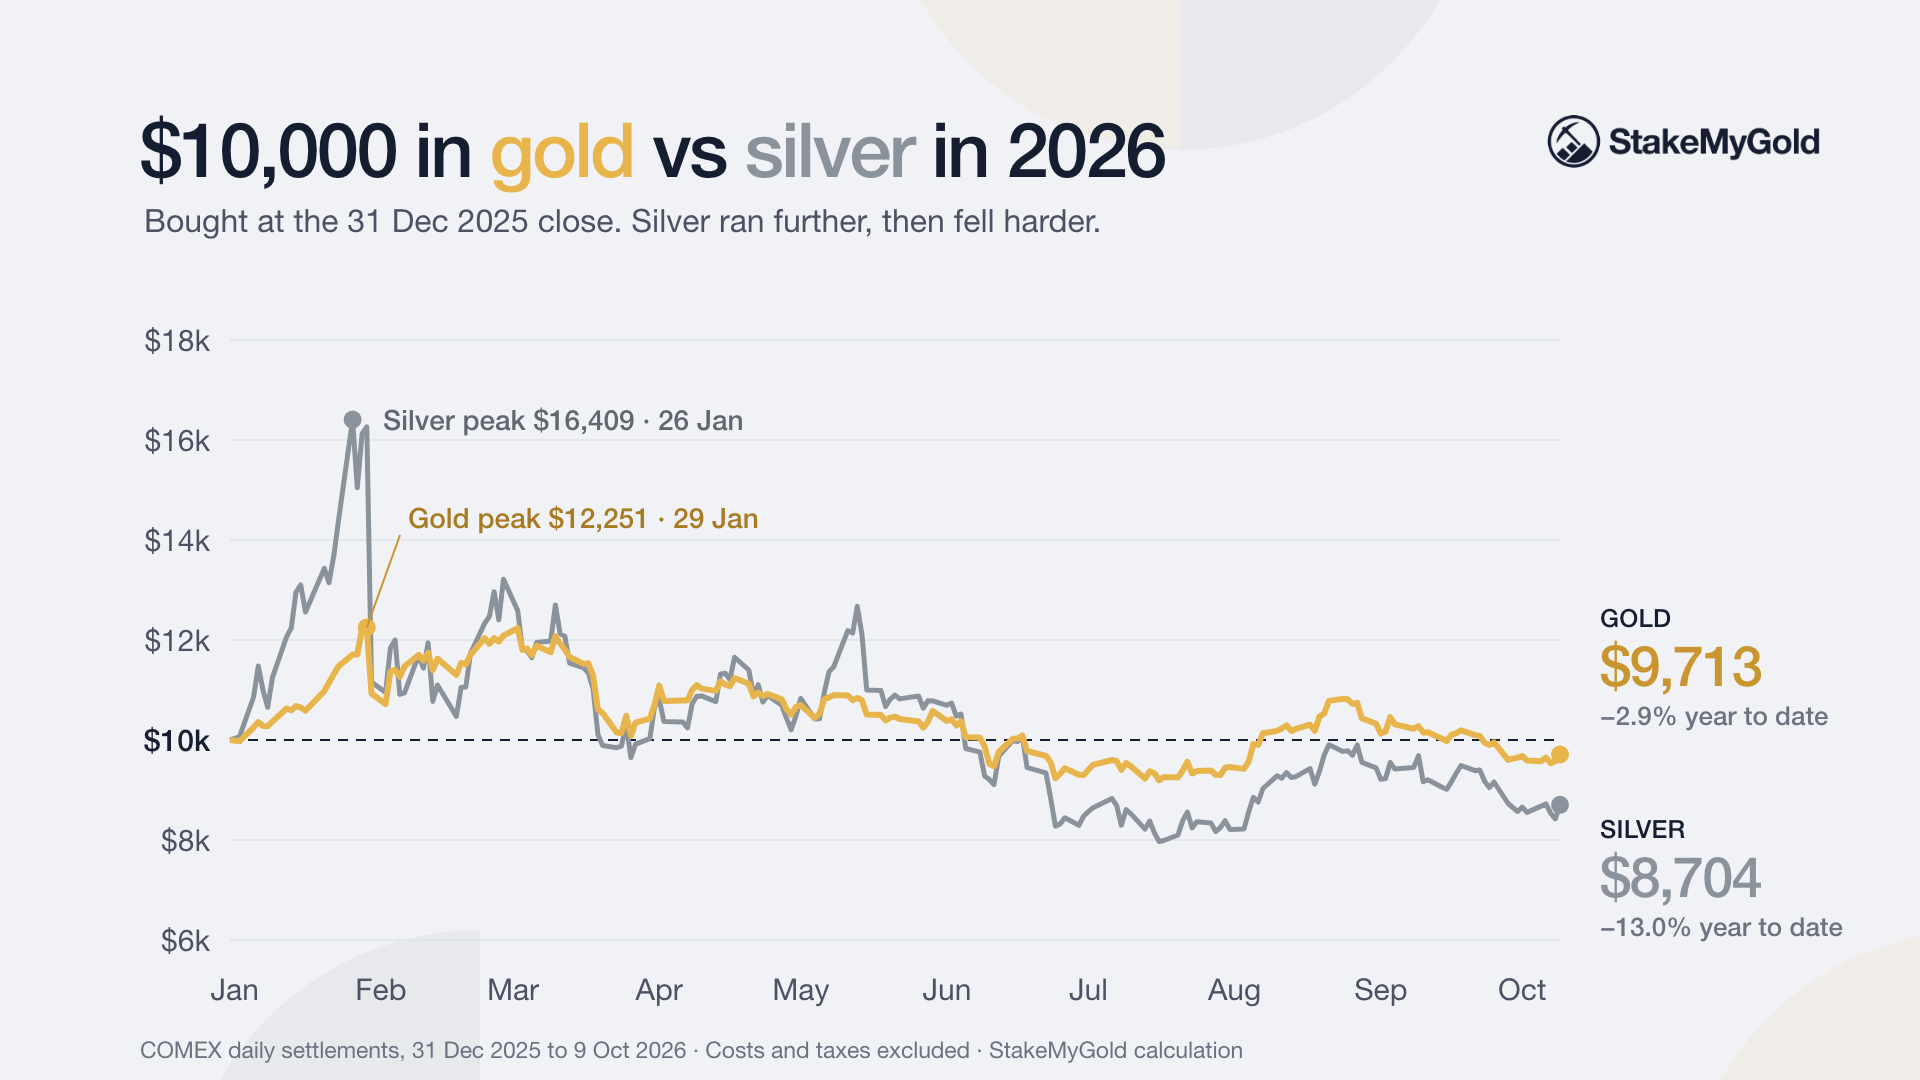
Silver investors saw their money go up by 64% in four weeks, then fall by more than half. Gold investors had a smaller ride both ways. A modest silver slice changed the outcome only a little: the 80/20 mix ended 2 points behind pure gold.
The example also shows a trap. Silver's January peak was the moment the "silver always outperforms in a bull market" story was loudest. Anyone who bought then is still down by close to half.
There is no single right answer, but the data points to clear fits. This is general information, not a recommendation for your situation.
Gold tends to suit you if:
Silver tends to suit you if:
On that last point: a low price per ounce does not make silver cheaper to invest in. Fractional gold coins, gold funds and gold tokens let you own gold in any dollar amount. What silver's low price really gives you is small coins to hold.
Daily data are COMEX front-month gold (GC=F) and silver (SI=F) settlements from 30 August 2000 to 9 October 2026, via Yahoo Finance. Long-run data are the monthly averages from January 1960 to September 2026 (London fixing prices). Volatility is the standard deviation of daily log returns times the square root of 252. Annual returns are compound annual growth rates. Drawdowns are peak-to-trough on the series named in each table. The script (compare.py) and data file (data.csv) are published with this article so anyone can rerun the numbers.
| Gold | Silver |
|---|
| Price, 9 Oct 2026 (COMEX settlement) | $4,216.30/oz | $61.05/oz |
| Share of 2025 demand from industry | ~6% (technology) | ~58% |
| Largest other buyers | Investors, jewelry, central banks | Coins and bars, jewelry |
| Volatility, 2000-2026 (annualized) | 18.0% | 33.5% |
| Fall from 2026 high to 2026 low | -25% | -51% |
| Deepest fall since 2000 | -44% (2011-2015) | -76% (2011-2020) |
| Annual return, 20 years to Oct 2026 | 10.4% | 8.8% |
| Annual return, 10 years to Oct 2026 | 12.9% | 13.4% |
| Space taken by $10,000 of metal | ~3.8 cubic cm (about one sugar cube) | ~485 cubic cm (about a pint jar) |
| 1 oz US Eagle coin premium, 11 Oct 2026 | 4.5% | 8.2% |
| Physically backed ETF fee | 0.40% (GLD) | 0.50% (SLV) |
| US long-term tax rate | Collectible, up to 28% | Collectible, up to 28% |
| Daily value cleared in London, June 2026 | $70.9 billion | $12.9 billion |
| Period | Gold volatility | Silver volatility | Silver vs gold |
|---|
| Sep 2000 - Oct 2026 | 18.0% | 33.5% | 1.9x |
| Last 10 years | 17.0% | 35.2% | 2.1x |
| Last 5 years | 19.2% | 40.4% | 2.1x |
| 2026 to 9 October | 30.0% | 71.8% | 2.4x |
| Episode | Gold | Silver |
|---|
| 1980 peak to bottom (monthly averages) | -62% (Jan 1980 to Jul 1999) | -91% (Jan 1980 to Mar 1993) |
| Back above the January 1980 average | May 2006 | April 2011 |
| 2008 financial crisis (daily) | -30% (Mar to Nov 2008) | -57% (Mar to Oct 2008) |
| 2011 peak to 2015 low (daily) | -44% | -72% |
| Back above the 2011 peak | July 2020 | October 2025 |
| Covid crash, 19 Feb to 23 Mar 2020 | -8% at worst | -36% at worst |
| 2026 high to 2026 low (daily) | -25% (29 Jan to 16 Jul) | -51% (26 Jan to 16 Jul) |
| Period (to Oct 2026) | Gold, total | Gold, per year | Silver, total | Silver, per year | Winner |
|---|
| 1 year | +6% | 6.1% | +30% | 30.3% | Silver |
| 5 years | +140% | 19.1% | +169% | 21.9% | Silver |
| 10 years | +238% | 12.9% | +252% | 13.4% | Silver |
| 20 years | +629% | 10.4% | +439% | 8.8% | Gold |
| 25 years | +1,359% | 11.3% | +1,248% | 11.0% | Gold |
| Since Jan 2000 (monthly) | x15.2 | 10.7% | x12.4 | 9.9% | Gold |
| Since Jan 1980 (monthly) | x6.4 | 4.1% | x1.7 | 1.1% | Gold |
| Since Jan 1971 (monthly) | x114 | 8.9% | x40 | 6.9% | Gold |
| Gold | Silver | 80% gold / 20% silver |
|---|
| Value at its 2026 closing high | $12,251 (29 Jan) | $16,409 (26 Jan) | n/a |
| Value at the 16 July low | $9,196 | $7,970 | n/a |
| Value on 9 October 2026 | $9,713 | $8,704 | $9,511 |
| Change for the year so far | -2.9% | -13.0% | -4.9% |
Our numbers use COMEX front-month futures settlements, which can differ slightly from the LBMA benchmark prices and from what you pay a dealer. The returns ignore costs, taxes and inflation. The 1980 and 1971 figures use monthly averages, which hide the most extreme prices. Early silver values in the World Bank series are rounded to 10 cents, which can shift those long-run figures by a few tenths of a percent a year.
Past volatility and returns do not predict the next decade. Silver's industrial demand could grow faster than the Silver Institute expects, or slower. Gold's central bank buying could fade. Premiums and fees on a single date are a snapshot, and they move.
StakeMyGold is a gold-only platform. It lets you stake GGBR, a gold-backed token, to earn a return paid in gold. PAXG and XAUT are listed as coming soon. There is no silver product, so if you want silver, this platform is not the place for it.
For the gold side of a portfolio, the FAQ states a target return for GGBR stakers that is not guaranteed and can be changed. Staking does not remove gold's price risk: a 25% fall in gold, like the one in 2026, is far larger than a year of staking income. GGBR is backed by certificates for gold still in the ground rather than vaulted bars, which we explain in what actually backs your token.
Is gold or silver a better investment? Over the long run gold has done slightly better with about half the volatility: 11.3% a year over 25 years against 11.0% for silver. Silver beat gold over 1, 5 and 10 years to October 2026. Gold fits a core holding; silver fits a smaller, higher-risk position.
Is silver more volatile than gold? Yes. On daily COMEX prices, silver's volatility was 1.9 times gold's from 2000 to 2026 and 2.4 times in 2026. It was more volatile than gold in all 25 calendar years from 2001 to 2025.
Why is silver so much cheaper than gold? Far more of it is mined: about 26,000 tonnes of silver in 2025, against about 3,670 tonnes of gold. Most silver is used up by industry, while gold is held as money by investors and central banks. On 9 October 2026, one ounce of gold bought about 69 ounces of silver.
Will silver hit $200 an ounce? At the October 2026 gold-silver ratio of about 69, $200 silver would need gold near $13,800. It could also happen if the ratio fell sharply. The latest dated bank forecasts we found run only to 2027 and top out near $80.
Are gold and silver taxed the same in the US? Yes. Both are collectibles, so long-term gains on bars, coins and physically backed ETFs are taxed at your ordinary rate, capped at 28%. Short-term gains are taxed as ordinary income.
Is silver harder to sell than gold? Not for small amounts; dealers buy both every day. But the gold market is about five times larger by daily value in London, and dealer spreads on silver are usually wider, so you lose a bigger share of your money on a round trip.
Gold vs silver is a choice between two levels of risk, not two stories. Silver has swung about twice as much as gold for 25 years, fallen about twice as far in every crisis we measured, and cost more to buy and store. Over long periods it has not paid more for that risk.
For most investors, that makes gold the core and silver, if any, the smaller satellite. Before you buy either, check three things: the premium over spot, what the dealer will pay you back, and whether you could live with silver's 51% fall in 2026 happening again.
This article is for informational purposes only and is not financial or tax advice.
