On 30 September 2026, gold ended the third quarter at $4,186.70 an ounce on COMEX, 21% below its 29 January closing high of $5,318.40. Nine months earlier it had finished 2025 up 66%, its best calendar year since 1979, according to the NYU Stern historical returns dataset. A boom and a sharp fall inside one year is exactly why people are asking again: is gold a good investment?
The short answer: gold has been a good diversifier and a mediocre growth asset. From 1971, when the US stopped converting dollars into gold, to the end of 2025, gold returned 9.0% a year, or 4.9% a year after inflation. That beat bonds and cash but trailed stocks with dividends (11.1% a year). It also went through a 62% crash that took 26 years to recover in dollars, and 45 years after inflation.
This article lays out that record: returns over six time periods against stocks, bonds, cash and inflation, every major gold crash and how long the recovery took, and what a small gold slice did to a standard portfolio. It does not try to tell you whether this month is a good time to buy. That is a different question, covered in is now a good time to buy gold.
Gold is a good investment for one job: holding value that does not depend on company profits or interest rates, and rising in some of the years when stocks and bonds fall. It is a poor investment if you need steady growth, income, or a guarantee of beating inflation over a ten-year horizon.
Three facts from 55 years of data explain that verdict:
The rest of this article shows the numbers behind each point.
Over the 55 years from 1971 to 2025, gold returned 9.0% a year. Stocks returned 11.1% and 10-year Treasury bonds 6.0%. Inflation ran at 3.9%. Which asset "won" changes a lot with the start date. The table uses the annual returns that Professor Aswath Damodaran of NYU Stern publishes for the S&P 500 with dividends, 3-month Treasury bills, 10-year Treasury bonds and gold, with US CPI inflation.
Annual return here means the compound annual growth rate: the steady yearly rate that turns the starting amount into the ending amount.
Source: Damodaran/NYU Stern annual returns (gold uses year-end prices; stock returns include reinvested dividends), our calculations. Gross of fees and taxes.
Two things stand out. First, gold beat bonds and cash in every period listed. Second, against stocks the result flips with the start date. Starting in 1976 or 1986 means starting after gold's first big run, and stocks won by 4.7 to 4.8 points a year. Starting in 2006 or 2016 captures gold's 2024-25 surge, and gold edged ahead. We compare gold and stocks in more detail, with crash-by-crash data, in gold vs the S&P 500.
A real return is what is left after subtracting inflation. It measures growth in buying power, which is what an investment is for.
Real return = (1 + nominal return) / (1 + CPI inflation) - 1, each year, then compounded.
Over every period, gold grew buying power. A dollar in gold at the start of 1971 had about 14 times its buying power by the end of 2025. Cash in T-bills barely kept up with prices. That is the strongest part of the case for gold.
Gold does not grow steadily. It moves in long eras, and the era you happen to buy in decides most of your result:
Source: Damodaran/NYU Stern annual data, our calculations.
The pattern is that gold did best when stocks and bonds struggled and inflation or crisis dominated the news, and worst when real interest rates (rates above inflation) were high and stocks were rising. The link with interest rates is covered in what happens to gold when interest rates rise.
An investor who bought gold in 1980 and one who bought in 2001 owned the same metal, but had completely different experiences. The worked example below puts numbers on that.
Gold has had five falls of 20% or more since 1971, measured on monthly average prices. The worst, from January 1980, took 26 years to recover in dollar terms and 45 years once inflation is counted. The table shows the four largest plus the 2026 decline (a short 21% dip in 1973 recovered within six months). A drawdown is a fall from a previous peak; recovery is the month the price got back to that peak.
Gold: World Bank Pink Sheet monthly averages (updated 2 October 2026). Inflation: BLS CPI-U, to August 2026. Monthly averages smooth out daily extremes; on COMEX daily closes the 2026 fall was 24.9%, from $5,318.40 on 29 January to $3,992.10 on 16 July.
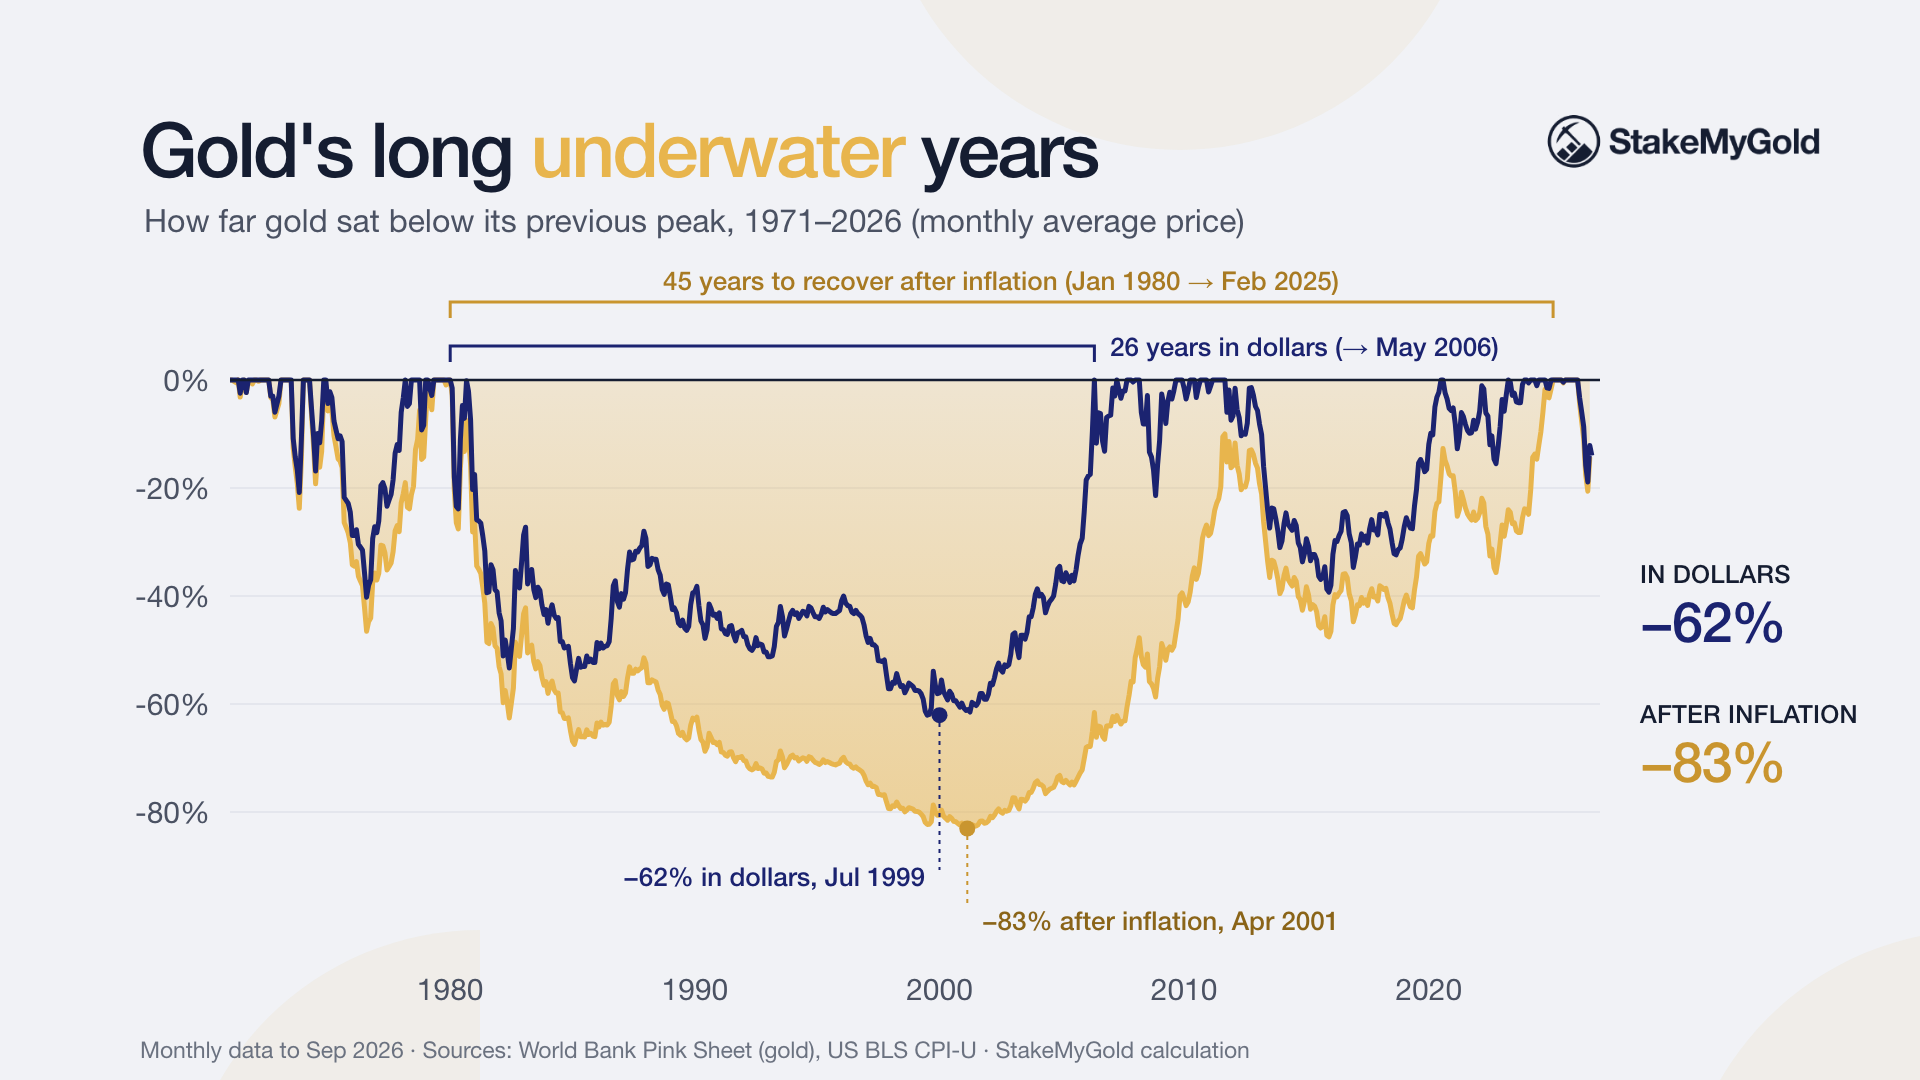
The 1980 row is the outlier. Adjusted for inflation, the January 1980 average price equals about $2,906 an ounce in August 2026 dollars. After inflation, gold fell 83% from that peak to its low in April 2001. It did not regain that buying power until February 2025. Anyone who bought at the 1980 top and held waited most of a working life to break even in real terms.
For comparison, the S&P 500 with dividends fell 47% from September 2000 to October 2002 and was back to its old high in October 2006, about six years later. It fell 55% from October 2007 to March 2009 and recovered by April 2012, about four and a half years later. Those stock crashes were about as deep as gold's worst, but recovered much faster, partly because dividends kept being paid and reinvested at low prices. Gold has no such cushion.
What caused the 2026 fall, and where gold has gone since, is covered in why gold is falling in 2026.
The long-run averages hide how uneven gold's record is. We tested every calendar window from 1971 to 2025 to see how often gold came out ahead:
| Period (calendar years) | Gold | S&P 500 with dividends | 10-year Treasury bonds | 3-month T-bills | Inflation (CPI) |
|---|
| 55 years (1971-2025) | 9.0% | 11.1% | 6.0% | 4.5% | 3.9% |
| 50 years (1976-2025) | 7.1% | 11.9% | 6.1% | 4.3% | 3.6% |
| 40 years (1986-2025) | 6.7% | 11.4% | 5.4% | 3.2% | 2.8% |
| 30 years (1996-2025) | 8.4% | 10.3% | 3.9% | 2.3% | 2.5% |
| 20 years (2006-2025) | 11.3% | 10.9% | 2.8% | 1.7% | 2.5% |
| 10 years (2016-2025) | 15.1% | 14.7% | 0.9% | 2.2% | 3.2% |
| Period | Gold, real | Stocks, real | 10-year Treasuries, real | T-bills, real |
|---|
| 1971-2025 | 4.9% | 7.0% | 2.0% | 0.5% |
| 1976-2025 | 3.4% | 8.0% | 2.5% | 0.7% |
| 1986-2025 | 3.8% | 8.4% | 2.6% | 0.4% |
| 1996-2025 | 5.7% | 7.5% | 1.3% | -0.2% |
| 2006-2025 | 8.5% | 8.2% | 0.3% | -0.8% |
| 2016-2025 | 11.6% | 11.1% | -2.2% | -0.9% |
| Era | Gold per year | Gold after inflation | Stocks per year | What drove gold |
|---|
| 1971-1980 | +31.8% | +22.0% | +8.5% | End of the gold standard, oil shocks, inflation near 8% a year |
| 1981-2000 | -3.8% | -7.1% | +15.5% | High real interest rates, falling inflation, a long stock boom |
| 2001-2011 | +17.2% | +14.5% | +1.5% | Dot-com bust, 2008 crisis, near-zero interest rates |
| 2012-2018 | -2.9% | -4.4% | +12.6% | Recovery, a strong dollar, rising rates from 2015 |
| Gold drawdown (monthly average price) | Peak | Low | Fall | Back to the peak in dollars | Back to the peak after inflation |
|---|
| 1974-1976 | $184 (Dec 1974) | $110 (Aug 1976) | -40% | Mar 1978 (3.3 years) | May 1979 (from the Apr 1974 real peak) |
| 1980-1999 | $675 (Jan 1980) | $256 (Jul 1999) | -62% | May 2006 (26 years) | Feb 2025 (45 years) |
| 2008 | $968 (Mar 2008) | $761 (Nov 2008) | -21% | Sep 2009 (1.5 years) | n/a (still below the 1980 real peak) |
| 2011-2015 | $1,772 (Sep 2011) | $1,076 (Dec 2015) | -39% | Jul 2020 (8.8 years) | Aug 2024 (13 years) |
| 2026 | $5,020 (Feb 2026) | $4,073 (Jul 2026) | -19% | Not yet ($4,319 in Sep 2026) | Not yet |
| Holding period | Windows tested | Gold beat inflation | Gold beat T-bills | Gold beat 10-year Treasuries | Stocks beat inflation |
|---|
| 1 year | 55 | 56% | 56% | 55% | 75% |
| 5 years | 51 | 59% | 57% | 53% | 75% |
| 10 years | 46 | 59% | 57% | 48% | 89% |
| 20 years | 36 | 64% | 56% | 42% | 100% |
Source: Damodaran/NYU Stern annual data, our calculations. Windows run calendar year to calendar year (for example, 10-year windows from 1971-1980 to 2016-2025).
A longer holding period did not make gold much more reliable. Over 20 years it beat inflation only about two times in three, while stocks beat inflation in every 20-year window. The worst 20-year window for gold, 1981-2000, lost 7.1% a year after inflation.
That is why "gold is an inflation hedge" needs a qualifier. Over 1971-2025, gold's yearly returns had a correlation of 0.41 with inflation, a moderate link. Correlation runs from +1 (always move together) to -1 (always move opposite). Gold did well in high-inflation decades such as the 1970s and badly in others. We look at each inflation episode in detail in is gold an inflation hedge.
Gold has no cash flow. A stock pays dividends, a bond pays interest, a T-bill pays interest, a rental property pays rent. An ounce of gold stays an ounce. Its whole return comes from the price going up.
That matters in three ways:
All the returns in this article are gross, before these costs. A real investor in gold earned somewhat less.
Gold's strongest case is not as a standalone investment but as a small part of a mix. Its yearly returns had almost no relationship with stocks (correlation -0.17) or bonds (-0.08) from 1971 to 2025. Assets that do not move together smooth out a portfolio.
We tested a classic 60/40 portfolio (60% S&P 500, 40% 10-year Treasuries) against the same mix with some gold, rebalanced back to target weights every year from 1971 to 2025:
| Portfolio, 1971-2025 | Annual return | After inflation | Volatility | Worst year | 1974 | 2008 | 2022 | $10,000 became |
|---|---|---|---|---|---|---|---|---|
| 60% stocks / 40% bonds | 9.5% | 5.4% | 11.1% | -18.0% (2022) | -14.7% | -13.9% | -18.0% | $1.47 million |
| 55% stocks / 35% bonds / 10% gold | 9.8% | 5.7% | 10.0% | -16.1% (2022) | -6.9% | -12.6% | -16.1% | $1.75 million |
| 50% stocks / 30% bonds / 20% gold | 10.1% | 6.0% | 9.7% | -14.3% (2022) | +0.9% | -11.4% | -14.3% | $1.99 million |
| 100% gold | 9.0% | 4.9% | 27.1% | -32.6% (1981) | +66.1% | +4.3% | +0.5% | $1.16 million |
Source: Damodaran/NYU Stern annual data, our calculations. Volatility is the standard deviation of yearly returns. Gross of fees and taxes.
Over the more recent 20 years (2006-2025), the 10%-gold mix returned 8.8% a year against 8.2% for the plain 60/40, with a smaller worst year in the same pattern.
Read this result carefully. The full period starts in 1971, gold's best decade, which flatters the gold mixes. The lower volatility and the smaller losses in 1974 and 2022 are the more durable findings. In 2022, stocks fell 18.0% and bonds fell 17.8% in the same year, and gold rose 0.5%. That kind of year is where a gold slice earns its place.
Holding 100% gold, on the other hand, gave a lower return than the 60/40 portfolio with more than twice the volatility. Gold on its own is a weaker investment than gold as one part of a plan. How large that part should be is covered in how much gold should you own.
Here is what $10,000 in gold did for two buyers, using World Bank monthly average prices and BLS inflation data:
| Buyer A: January 1980 | Buyer B: April 2001 | |
|---|---|---|
| Gold price paid (monthly average) | $675 | $260 |
| Ounces bought with $10,000 | 14.8 | 38.5 |
| Value at September 2026 average ($4,319) | $63,985 | $166,115 |
| $10,000 adjusted for inflation to August 2026 | $43,057 | $18,936 |
| Gain in buying power | +49% | +777% |
| Real return per year | 0.9% | 8.9% |
Buyer A held through 46 years of gold's history and ended up with about half again as much buying power, less than 1% a year after inflation, before any costs. Buyer B bought near the low and multiplied buying power almost ninefold. Both bought the same asset. The difference was the entry price, which no one can see in advance. That is the main argument for buying gold gradually, which we cover in dollar-cost averaging into gold, rather than in one go.
Is investing in gold a good idea for you? It depends far more on your situation than on the gold price.
Gold tends to suit people who:
Gold tends not to suit people who:
If you decide gold does belong in your plan, our guide on how to invest in gold compares bars, coins, ETFs and tokens.
analysis.py and the raw data folder reproduce every number in this article.StakeMyGold lets holders of GGBR, a gold-backed token, stake it to earn a return paid in gold. GGBR is backed by in-ground gold certificates rather than vaulted bars. The site's FAQ advertises target rates of up to 15% APR, says yields are not guaranteed and can change, and lists smart contract, counterparty, liquidity and gas-fee risks. Under the optional lock, unstaking early costs 30% of the rewards earned. The yield strategy page says returns come mainly from gold-backed lending, with DeFi lending used depending on scale and risk.
What it can address: gold's lack of income, the gap described above. What it cannot do: a yield does not stop gold's price from falling 20% or 60%, and it adds risks that bars in a vault do not have, from smart contract bugs to a borrower failing. We set those out in is gold staking safe. If you do not hold gold yet, an ETF or bullion is a simpler first step. Staking is for people who already hold gold and understand the extra risk.
Is gold a good long-term investment? Over 55 years it has been a decent one: 9.0% a year from 1971 to 2025, or 4.9% after inflation. That beat bonds and cash but not stocks with dividends. Long-term holders also had to sit through a 26-year wait to recover the 1980 peak in dollars.
Has gold beaten inflation? Over the full period since 1971, yes, by about 4.9 points a year. Over shorter spans it is unreliable: gold beat inflation in 59% of ten-year windows and 64% of twenty-year windows between 1971 and 2025.
Is gold better than stocks or bonds? For growth, stocks have usually done better. For diversification, gold has helped: its yearly returns showed little link with stocks or bonds, and it held up in years like 1974, 2008 and 2022. Against 10-year Treasuries, gold won over 55 years but lost in more than half of the twenty-year windows.
How long did gold take to recover from its 1980 peak? The January 1980 monthly average of $675 was not matched again until May 2006, about 26 years later. After inflation, gold did not regain its 1980 buying power until February 2025, 45 years later.
Is buying physical gold a good investment? Physical gold carries the same price record as any other gold, plus dealer premiums, storage and insurance, and in the US a collectibles tax rate of up to 28% on gains. It suits people who want metal they control directly, and costs more to own than a low-fee ETF.
How much of my portfolio should be in gold? There is no universal number. In our 1971-2025 test, a 10% gold slice lowered a 60/40 portfolio's volatility and worst year. Our article on how much gold you should own walks through sizing.
Is now a good time to buy gold? That is a timing question, which this article does not try to answer. See is now a good time to buy gold.
Is gold a good investment? As a small, long-term part of a diversified portfolio, the 55-year record says yes: it beat inflation, bonds and cash over the full period, and it tended to rise or hold when stocks and bonds fell. As your main investment, the record says no: stocks grew faster, gold paid nothing along the way, and its worst crash took 45 years to recover after inflation. Buy it for what it does when everything else is falling, size it so a 40% drop would not hurt you, and do not expect it to grow your savings on its own.
This article is for informational purposes only and is not financial or tax advice. Past returns do not predict future returns.
