On 2 October 2026 the World Bank published its September gold average: $4,319 an ounce, 23% below the $5,595 intraday record set on 29 January. Searches for "dollar cost averaging gold" peaked that same January. Many people who bought the top are now asking whether they should have spread their buying out, and many who are still on the sidelines are asking whether to start.
We tested it instead of guessing. Using 50 years of monthly gold prices, we re-ran the lump-sum-versus-cost-averaging test that Vanguard ran on stocks, and added three more checks: a $500-a-month plan, a plan that started at the January record, and the premiums that small physical purchases cost you.
The short answer: for gold, lump sum versus dollar cost averaging has been close to a coin flip. DCA's real value is protection against buying at a peak, and its real cost is the premiums you pay on small purchases.
Dollar cost averaging gold (DCA gold) means buying a fixed dollar amount of gold on a fixed schedule, such as $500 on the first of every month, regardless of the price. When gold is cheap, your $500 buys more; when it is expensive, it buys less. Your average cost per ounce ends up below the simple average of the prices on your purchase dates.
Two different situations get the same name, and they need different answers:
Most of this article is about the second case, because that is where the choice exists.
We used monthly gold prices from the World Bank Commodity Price Data ("Pink Sheet"), release of 2 October 2026. Up to May 2025 each month is the average of the daily LBMA PM price (the London afternoon benchmark); from June 2025 it is the average of daily spot prices. For the interest earned by money waiting to be invested, we used the 3-month US Treasury bill rate (FRED series TB3MS).
Rules we applied everywhere:
The Python script (dca_backtest.py, standard library only) and the data file (data.csv, 669 months from January 1971) are published with this article, so anyone can check or change the inputs. That makes it a working gold DCA calculator: change the monthly amount, the start date or the premium and run it again.
In StakeMyGold's backtest of 609 rolling start months from January 1975 to September 2025, investing a lump sum in gold beat spreading it over 12 months exactly half the time, once the waiting cash earned T-bill interest. That is a weaker case for lump sum than in stocks, where Vanguard found lump sum ahead about two-thirds of the time.
The method copies Vanguard's February 2023 paper Cost averaging: Invest now or temporarily hold your cash? For every start month, we invest $1 either all at once or in equal monthly installments, then compare wealth 12 months after the start. Vanguard ran this on the MSCI World stock index from 1976 to 2022 and found lump sum beat a 3-month cost averaging plan 68% of the time.
Here is the same test on gold:
Source: StakeMyGold analysis of World Bank monthly gold prices and FRED TB3MS, 609 start months, 12-month horizon. Edge = lump-sum wealth minus DCA wealth per $1 invested.
Why the difference from stocks? Vanguard's own explanation is that lump sum wins because the asset usually beats cash, so being invested sooner pays. Over 1976–2022, Vanguard notes, US stocks beat T-bills 76% of the time. Gold has no dividend and no earnings, so its edge over cash comes and goes in long waves:
| Start months | Lump sum beat 12-month DCA | Gold beat T-bills over the year |
|---|---|---|
| 1975–1999 |
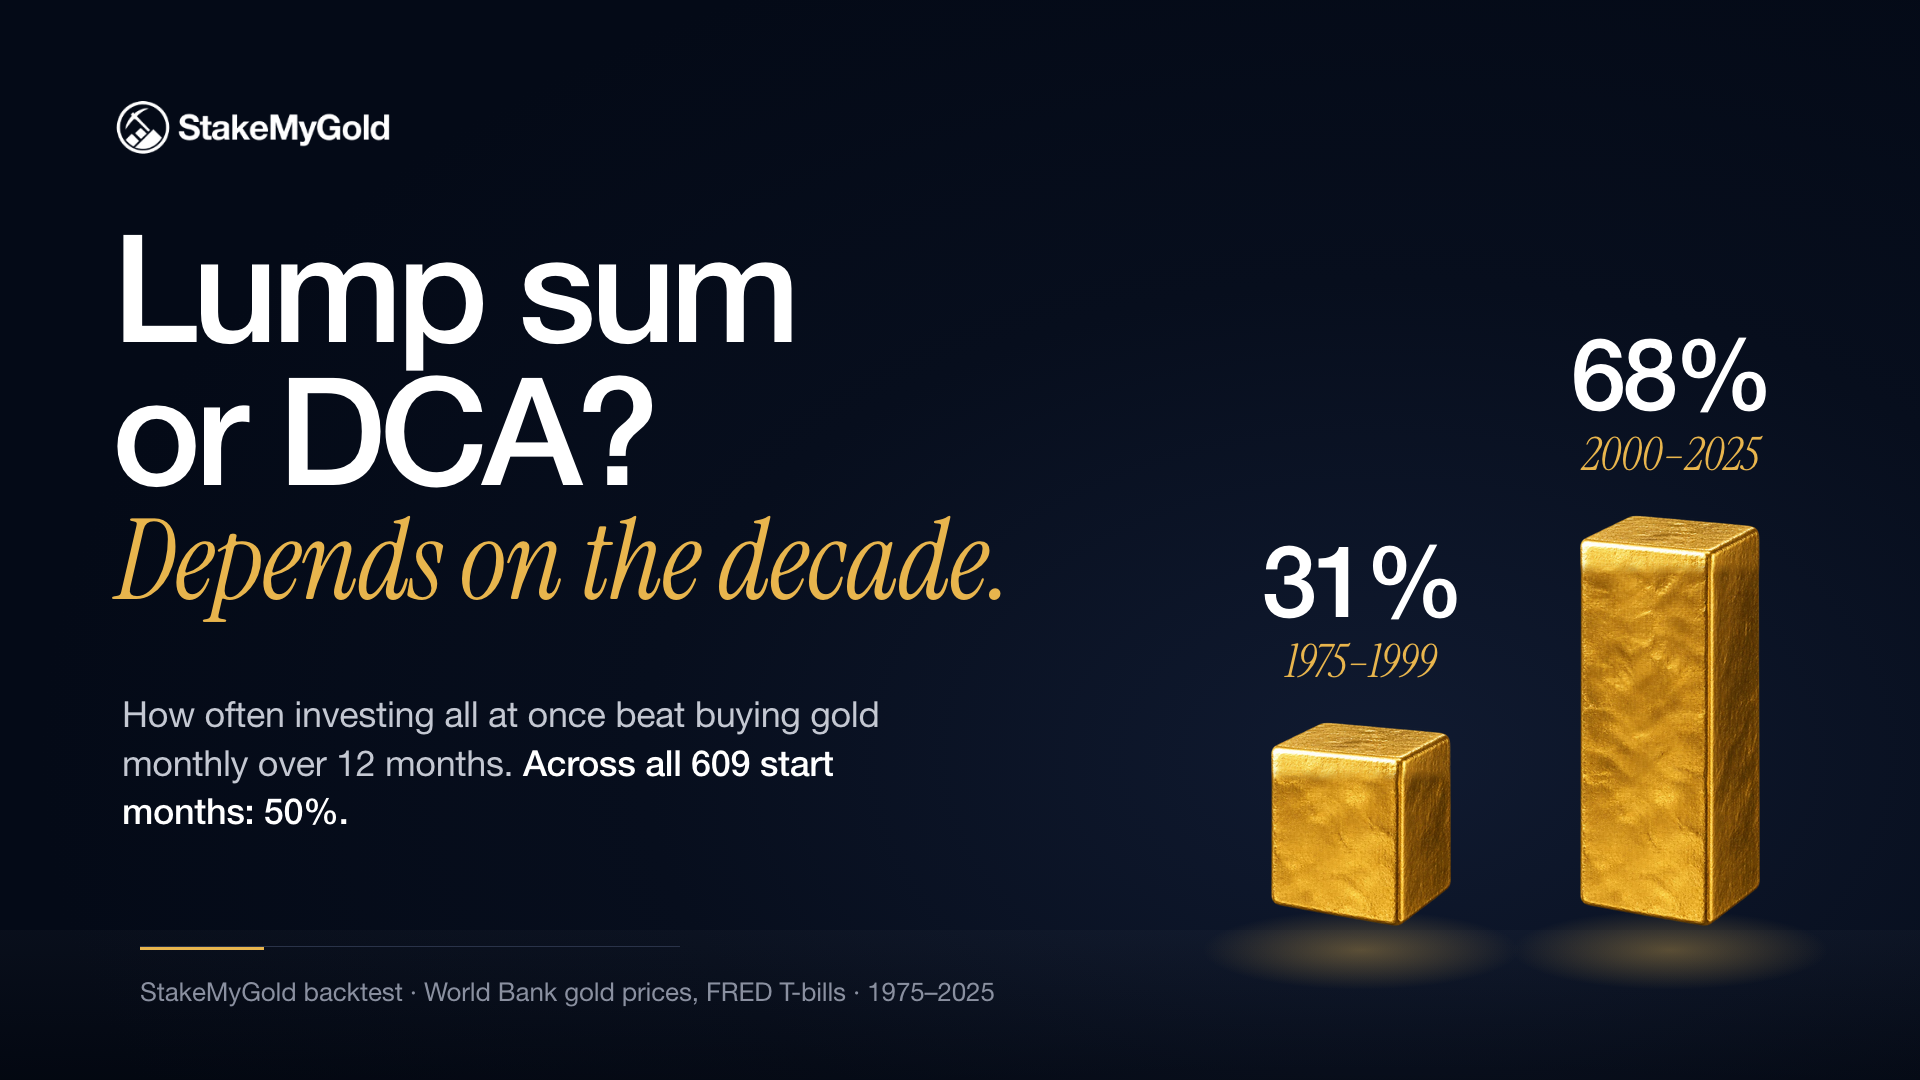
From 2000 onward, gold looked like stocks in this test: lump sum won about two-thirds of the time. From 1975 to 1999, when gold spent most of two decades below its 1980 peak and T-bills paid high rates, DCA won most of the time. The ranges in the first table also matter more than the medians: in the best year for lump sum it finished 70% ahead; in the worst it finished 28% behind.
A $500-a-month gold plan that started in October 2006 turned $120,000 of contributions into about $380,000 by September 2026, an average cost of $1,364 an ounce. Shorter plans did well too, because gold rose in most of this period.
| Cost averaging period | Interest on waiting cash | Lump sum wins | Median edge of lump sum | Worst case for lump sum | Best case for lump sum |
|---|
| 3 months | 0% (Vanguard's base case) | 52% | +0.2% | −12.2% | +29.6% |
| 3 months | 3-month T-bill | 47% | −0.2% | −13.3% | +28.6% |
| 12 months | 0% | 58% | +1.6% | −22.0% | +76.0% |
| 12 months | 3-month T-bill | 50% | 0.0% | −28.4% | +69.8% |
| 31% |
| 34% |
| 2000–2025 | 68% | 71% |
| Full period | 50% | 52% |
| Horizon | First buy | Invested | Ounces bought | Average cost/oz | Value (Sep 2026) | Annual return (money-weighted) |
|---|
| 5 years | Oct 2021 at $1,777 | $30,000 | 12.57 | $2,387 | $54,290 | 23.9% |
| 10 years | Oct 2016 at $1,267 | $60,000 | 33.55 | $1,789 | $144,890 | 16.8% |
| 20 years | Oct 2006 at $586 | $120,000 | 87.97 | $1,364 | $379,941 | 10.4% |
Money-weighted return accounts for when each $500 went in. Valued at the September 2026 average of $4,319.
If the same totals had been invested on day one, the lump sums would have been worth more ($72,915, $204,530 and $884,437). That comparison is not fair to a monthly saver, who never had $120,000 in 2006. It does show the trade-off: in a rising market, money that waits misses gains. The annual return of the 20-year plan (10.4%) is almost identical to the lump sum's (10.5%); the dollar gap comes from how long the money was invested, not from DCA buying badly.
Take a saver who started in October 2025. The monthly averages ran from $4,058 in October 2025 up to $5,020 in February 2026, then down to $4,073 in July. Each $500 bought between 0.0996 oz (February) and 0.1232 oz (October 2025). After 12 purchases, the saver holds 1.354 oz at an average cost of $4,430, about 2.6% above the September 2026 average. The $6,000 is worth $5,850, a 2.5% loss. Someone who put the full $6,000 in at the February average would be 14% under water at the same date.
$6,000 invested at the $5,595 intraday record on 29 January 2026 was worth $4,631 at the September average, a 22.8% loss. The same $6,000 spread as $750 a month from February to September was worth $5,750, a 4.2% loss.
| Strategy | Ounces | Average cost/oz | Value at Sep 2026 avg ($4,319) | Gain/loss |
|---|---|---|---|---|
| Lump sum at the intraday record ($5,595, 29 Jan) | 1.072 | $5,595 | $4,631 | −22.8% |
| Lump sum at the February 2026 average ($5,020) | 1.195 | $5,020 | $5,162 | −14.0% |
| DCA, $750/month, Feb–Sep 2026 | 1.331 | $4,506 | $5,750 | −4.2% |
At the lowest monthly average of the year, July's $4,073, the record buyer's $6,000 was worth $4,367, a 27% paper loss. The DCA buyer had $4,500 invested, worth $4,023 (down 11%), and $1,500 still in cash. Gold now needs to rise about 4% from the September average for the DCA buyer to break even, versus about 30% for the record buyer.
This is the case DCA exists for. Vanguard's paper puts it plainly: cost averaging is for investors with "very high aversion to both risk and losses" who might otherwise hold everything in cash. If a 23% drop in your first eight months would make you sell, spreading out your purchases is worth its expected cost.
For whether today's price is a good entry point, see our separate analysis of whether now is a good time to buy gold. DCA is a way to avoid answering that question.
When you dollar cost average gold with small coins, the dealer premium can cost more than DCA saves. FINRA warns that cost averaging "might result in higher fees than lump sum investing" because you make more transactions. With physical gold, the fee is the premium over spot, and small items carry the largest premiums.
Dated premium data (FindBullionPrices, lowest tracked dealer price vs spot):
We applied these to the 5-year, $500-a-month plan ($30,000 invested, October 2021 to September 2026):
| Route | Ounces | Value (Sep 2026) | Cost vs buying at spot |
|---|---|---|---|
| Spot price, no costs (benchmark) | 12.57 | $54,290 | — |
| 1/10 oz coin monthly, 8.3% premium | 11.61 | $50,124 | −$4,165 (−7.7%) |
| 1/10 oz coin monthly, 11.1% premium | 11.32 | $48,879 | −$5,411 (−10.0%) |
| Save up, buy whole 1 oz bars at 0.9% | 11.00 + $3,376 cash | $50,885 | −$3,405 (−6.3%) |
| Gold ETF, 0.10% a year (e.g. GLDM) | 12.53 | $54,134 | −$156 (−0.3%) |
| Gold ETF, 0.40% a year (e.g. GLD) | 12.43 | $53,669 | −$621 (−1.1%) |
| Gold token, 0.5% assumed cost per buy | 12.51 | $54,020 | −$270 (−0.5%) |
Three things stand out:
If you prefer to hold metal, the difference between coins and bars matters more for a DCA plan than for a single purchase. For the ETF side, see what GLD and IAU cost over ten years against tokenized gold.
DCA makes sense when:
DCA makes less sense when:
StakeMyGold is a platform for staking gold-backed tokens, so we have an interest in this topic. Here is what is relevant to a DCA plan, and what is not.
What fits. GGBR, the gold-backed token used on StakeMyGold, represents one-thousandth of a troy ounce, so a $50 or $500 monthly buy works without rounding to coin sizes. Staked GGBR earns a yield paid in gold tokens, which means the yield increases your ounce count, not a dollar balance. For a DCA investor, that is a second source of accumulation alongside the monthly buys.
To show the effect only: if the 5-year plan above had earned an assumed 6% a year in gold, minus a 5% performance fee, it would hold about 14.8 oz instead of 12.5 oz. 6% is an assumption for illustration, not a rate we promise. StakeMyGold's target rate floats, and our own guide to what staking can realistically earn models a range of scenarios.
What does not fit yet, and the risks.
Read the risks most gold staking platforms leave out before you put a DCA plan on-chain.
Is dollar cost averaging gold a good strategy? It is a good way to control timing risk and keep buying through drops, not a way to earn more. In our 50-year test, lump sum beat 12-month DCA half the time when waiting cash earned T-bill interest. DCA works best when you buy from income through a low-fee vehicle.
Is it better to buy gold all at once or over time? Historically it has been close to even. Lump sum won 68% of the time when starting from 2000 onward, but only 31% of the time from 1975 to 1999. If a sharp drop would make you sell, buying over 3 to 12 months is the safer choice.
What if I invested $10,000 in gold 20 years ago? $10,000 invested in October 2006, at that month's average of $586 an ounce, bought about 17 ounces. At the September 2026 average of $4,319, that gold was worth about $73,700, roughly 10.5% a year before costs and taxes.
Is investing in gold a good idea in 2026? That depends on your existing portfolio and your reason for owning gold, not on the calendar. Gold fell about 23% from its January record to the September average, which is a reminder that it is volatile. Our analysis of whether now is a good time to buy gold covers the current market.
What is the cheapest way to dollar cost average gold? A low-fee gold ETF or a fractional gold token. In our 5-year example, a 0.10% ETF cost 0.3% of the final value, against 7.7% to 10% for monthly 1/10 oz coins.
How often should I buy when I DCA gold? Monthly is the usual choice. More frequent buying adds transactions without much additional smoothing. Every two or three months can make sense if each purchase carries a fixed cost, such as a network fee.
Dollar cost averaging gold does not reliably beat buying all at once. Over 50 years it has been a coin flip, and the winner depended on whether gold beat cash. What DCA does well is limit the damage of buying at a peak, as January 2026 buyers found out. If you use it, keep the costs down: avoid small coins with high premiums, earn interest on the cash you are waiting to invest, and automate the buys so you are not tempted to time them.
This article is for education only and is not financial, tax or investment advice. Past performance does not predict future results. StakeMyGold operates a gold staking platform and has an interest in tokenized gold. Do your own research and consider a licensed adviser before investing.
