On 14 October 2026, COMEX silver futures closed at $55.55 an ounce, their lowest close since November 2025 and 52% below the record close of $115.08 set on 26 January. Five days later, on 19 October, the research firm Metals Focus said it expects silver to average $84.40 an ounce in 2027. J.P. Morgan's latest forecast for the same year, published in August, is an average of $63.90. Two serious forecasters, looking at the same market, are about $20 apart on next year alone. If you are searching for a silver price prediction for 2030, keep that gap in mind.
That gap is the honest starting point. We found no major bank with a dated silver forecast for 2030. What exists are 12-to-18-month bank calls, supply and demand data from the Silver Institute, and a simple formula that links silver to gold. This article uses all three.
Short answer: with silver at $57.00 at the 16 October 2026 close, a reasonable base case for 2030 is $70 to $85 an ounce. A bull case of $140 to $155 needs gold near $7,000 and silver to outperform the way it did in January 2026. A bear case of $45 to $50 needs gold to stall near $4,000 while silver lags. Each case is built from stated assumptions below, so you can rerun it with your own numbers.
Silver is trading near $57 an ounce after one of the most volatile two years in its history. Any silver price forecast for 2026 or later has to start from that.
With COMEX gold at $4,181.10 on 16 October, the gold-silver ratio (how many ounces of silver buy one ounce of gold) is about 73. Keep that number. It does most of the work in the 2030 scenarios.
The table below lists only forecasts we could tie to a named institution and a date. Forecasts change often, so the date matters as much as the number. Note that silver at $57 is already below every 2026 figure in the table, so several of these calls are likely to be cut again.
Sources: each institution's research page or news reports of its notes, linked below; all re-checked on 19 October 2026.
The details: UBS set its targets of $70 for December and $80 by September 2027 on 21 September. Bank of America said in May that silver could reach $100 in the fourth quarter but trade around $75 by mid-2027. HSBC raised its 2026 average to $75 and its 2027 average to $68. The World Bank expects silver to average around $70 in 2026 and fall 7% in 2027.
The 2026 numbers cluster around $70. The 2027 numbers range from the low $60s to the mid $80s. None of these forecasters puts a public number on 2030.
From 2028 onward there are no dated bank forecasts to cite. So the rows below switch from named forecasts to our scenario math: an assumed gold price divided by an assumed gold-silver ratio. The method is explained in the next section.
2028 and 2029 are straight-line steps from the 2027 forecast range to the 2030 cases, not forecasts.
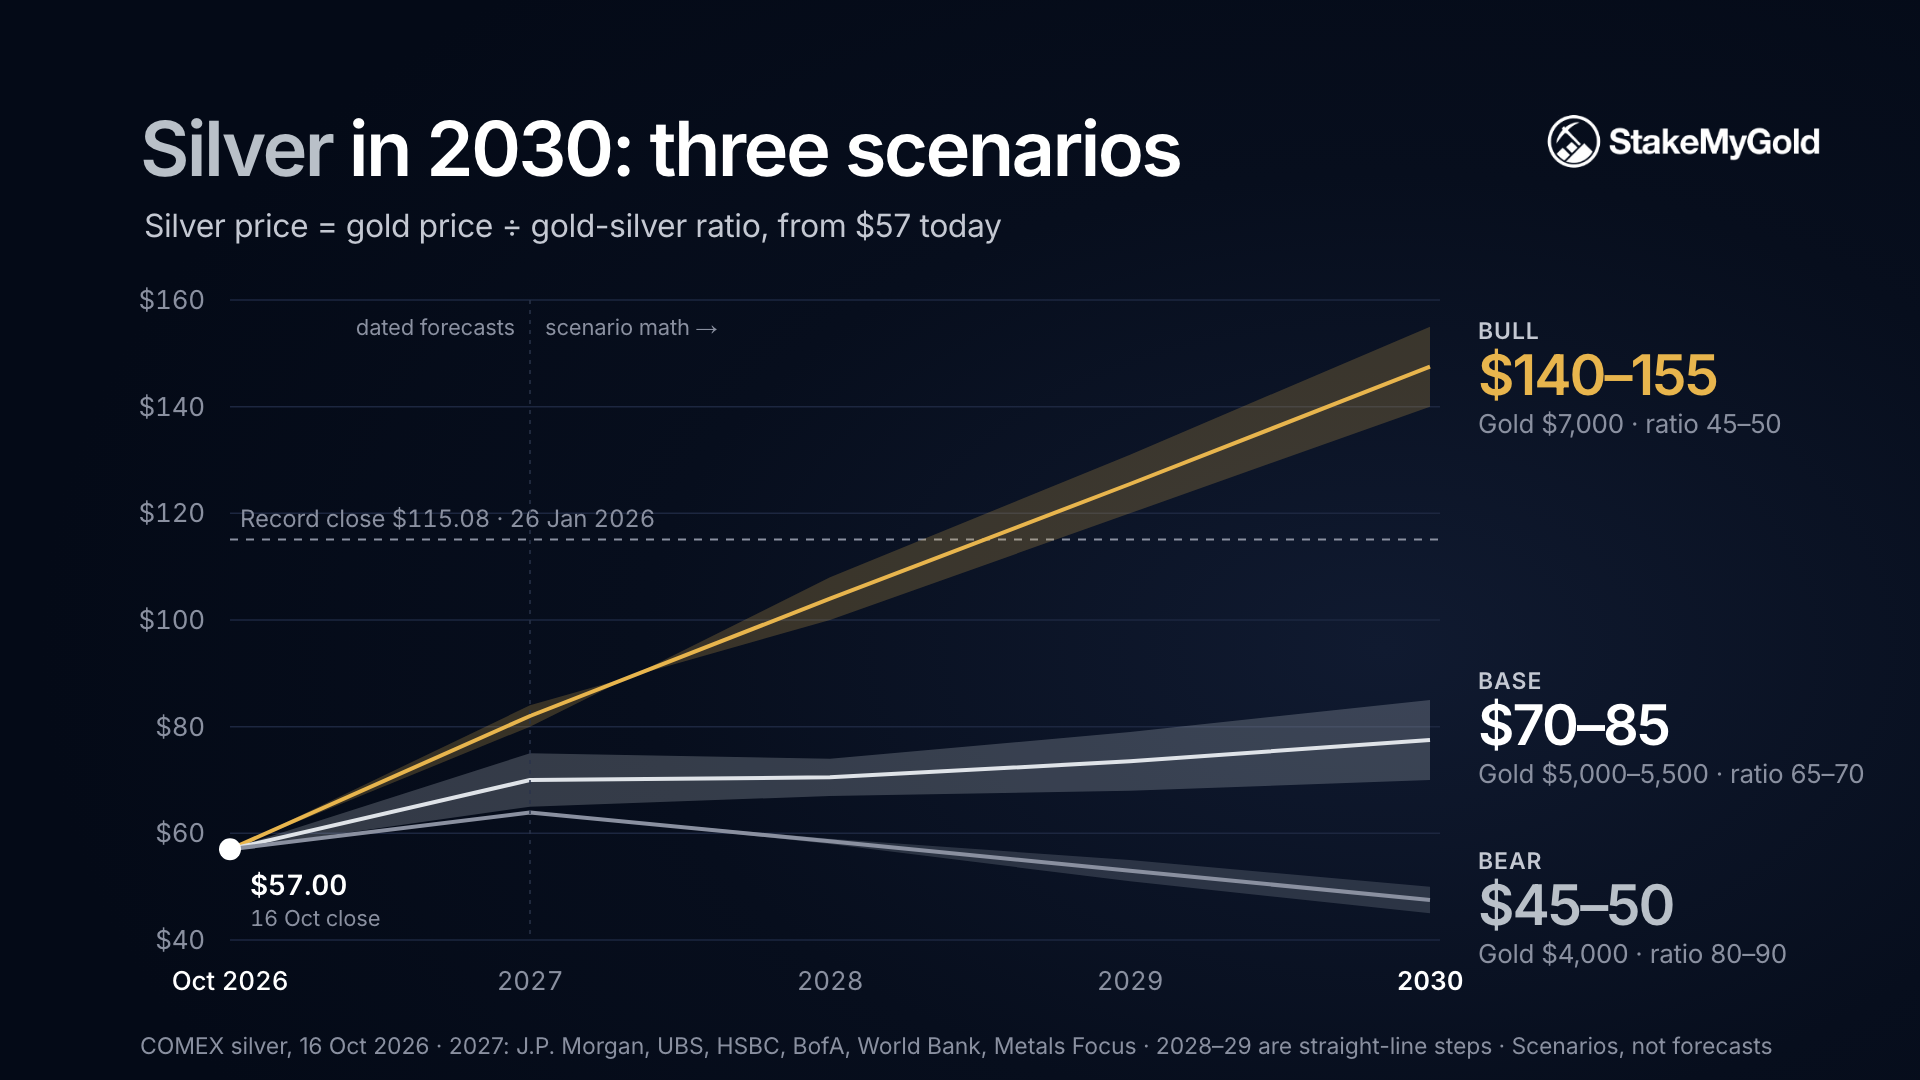

The in-between rows show the path each case implies, so you can check every year whether the market is tracking it. Spot prices were checked on 19 October 2026, using the latest complete COMEX session (16 October). Anything we could not tie to a named source and date was left out, including several "bank" figures that circulate on dealer sites without a date.
The gold-silver ratio is the number of ounces of silver needed to buy one ounce of gold. Every case below uses one formula built on it:
Silver price = gold price ÷ gold-silver ratio
This is not a theory of value. It is arithmetic. It is useful because the two inputs are easier to argue about than silver alone: gold has a deep forecasting literature, and the ratio has a 50-year history. Our article on what the gold-silver ratio measures and what it predicts explains why the ratio describes a relationship rather than forecasting one. Here we only use it as a dial.
| Institution | Date of call | 2026 | 2027 | Note |
|---|
| Metals Focus | 19 Oct 2026 | $72.60 avg | $84.40 avg; above $90 in Q4 | Research firm, not a bank. Also sees gold averaging $5,330 in 2027 |
| UBS | 21 Sep 2026 | $70 by Dec 2026 | $75 (Mar and Jun), $80 by Sep 2027 | Sees limited room for the ratio to stay above 70 |
| J.P. Morgan | 13 Aug 2026 | $70.60 avg; Q4 $63.00 | $63.90 avg | Cut from $84.30 and $85.80. Expects the ratio near 70 in H2 2026 and about 75 in 2027 |
| Bank of America | 27 May 2026 | $100 possible in Q4 | about $75 by Q2 2027 | Said gains above $100 would not last |
| HSBC | 17 May 2026 | $75 avg; $70 year-end | $68 avg; $65 year-end | Raised from $68.25 and $57, but expects deficits to shrink |
| World Bank | 28 Apr 2026 | about $70 avg | about 7% lower than 2026 | Commodity Markets Outlook, April 2026 |
| Year | Basis | Bear | Base | Bull |
|---|
| 2026 | Forecasts (avg) | $63 (JPM Q4) | about $70 (JPM, UBS, World Bank) | $72.60 to $75 (Metals Focus, HSBC) |
| 2027 | Forecasts | $63.90 (JPM avg) | $65 to $75 (World Bank, HSBC, UBS, BofA) | $80 to $84 (UBS Sep 2027, Metals Focus avg) |
| 2028 | Scenario math | $58 to $59 | $67 to $74 | $100 to $108 |
| 2029 | Scenario math | $51 to $55 | $68 to $79 | $120 to $131 |
| 2030 | Scenario math | $45 to $50 | $70 to $85 | $140 to $155 |
Worked example. Say you think gold reaches $6,000 by 2030 and the ratio settles at 60. Then silver = $6,000 ÷ 60 = $100. If the ratio stays at today's 73 instead, silver = $82. That $18 gap is what a move of about $1,100 in gold would do at a ratio of 60. For silver, the ratio matters as much as the gold forecast.
Four forces decide where silver ends the decade: the size of the market deficit, how much silver solar panels keep using, how mine supply responds, and what gold and interest rates do.
A market deficit means that total demand in a year (industry, jewelry, coins and bars, silverware) exceeds new supply (mine output plus recycling). The gap is filled from existing stocks.
The Silver Institute and Metals Focus, in the World Silver Survey 2026, put the 2025 deficit at 40.3 million ounces and expect the deficit to widen to 46.3 million ounces in 2026. That would be the sixth deficit in a row, and about 762 million ounces have been drawn from stocks since 2021. The often-quoted 67 million ounces came from the Institute's February 2026 preview and has since been revised down. Figures above 200 million ounces are not current Silver Institute estimates.
To put 46 million ounces in scale: it is about 5% of 2025 mine output of 846.6 million ounces. That tightens the market, but it does not by itself push prices higher. Silver's 2026 crash came during a deficit year.
Silver paste carries current across the face of a solar cell. Photovoltaics (PV) took 29% of industrial silver demand in 2024, according to Oxford Economics research for the Silver Institute. The share is now shrinking.
For 2030, this is the most important uncertainty. When silver is expensive, solar makers switch away from it faster, so high prices reduce demand. That puts a soft ceiling on bull cases built on solar growth alone.
Most mined silver is a by-product: silver recovered from mines run for other metals. Roughly 70% of supply comes as a by-product of copper, lead and zinc mining, and the Silver Institute says lead and zinc mines remain the largest single source. A copper miner does not open a new pit because silver went up. So supply responds slowly to price in both directions.
Recycling is the faster lever. It reached 197.6 million ounces in 2025, a 12-year high, and the Silver Institute expects it to pass 200 million ounces in 2026 for the first time since 2012. In November 2025 the US Interior Department also added silver to the US critical minerals list, a policy signal that matters for stockpiling and permitting over the decade.
Silver behaves like a higher-volatility version of gold. UBS made the same point in September 2026, noting the silver-gold correlation was near multi-year highs. Higher interest rates raise the cost of holding a metal that pays no interest. If you want to know where silver is going, start with gold. Our gold price prediction 2030 covers the gold side, and why gold is falling in 2026 covers the rate shock behind this year's drop. For how the two metals have compared as holdings, see gold vs silver.
Short answer: not plausibly by 2030. Silver at $500 an ounce would need gold at $7,000 and a gold-silver ratio of 14. That is the 1980 low, which Bank of America used in January 2026 to work out a theoretical silver peak of $309, against $135 at the 2011 ratio low of 32. Even the bank presented those as ratio arithmetic, not forecasts.
Run it at other ratios:
| Ratio assumed | Gold price needed for $500 silver |
|---|---|
| 14 (1980 low) | $7,000 |
| 32 (2011 low) | $16,000 |
| 45 (Jan 2026 low area) | $22,500 |
| 73 (16 Oct 2026) | $36,500 |
There is also a demand problem. At $500 an ounce, silver paste would cost so much that solar makers would replace it with copper almost entirely. Hundreds of millions of ounces of industrial demand would disappear at the prices needed to sustain $500.
For comparison, silver averaged $38.90 an ounce in January 1980 in the World Bank's monthly price data. Adjusted with the Bureau of Labor Statistics consumer price index, that is about $167 in August 2026 dollars, and even January 2026's record month did not reach it in real terms. $1,000 silver runs into the same problem: it needs gold at $14,000 even at the 1980 ratio.
If you searched this topic, you may have seen figures like "$3,598.75 by the end of 2030." Those come from algorithmic forecast pages. These pages project recent price moves forward automatically, using momentum and moving averages, with no supply, demand or gold input.
The model's 2030 number fell by about 98% in under nine months without any new fundamental information. It is describing the recent chart, not the future price. Use these pages to see recent momentum, not as forecasts.
We found no bank or institution with a published 10-year or 2040 silver forecast. Online figures for those years usually come from applying a fixed annual growth rate to today's price.
The ratio formula still works over that horizon. If gold compounds at 5% a year from $4,181, it reaches about $8,300 by 2040. At a ratio of 60 that implies about $138 silver. At 80 it implies about $103. Over 14 years, the uncertainty around both inputs is larger than the gap between those two outputs, so treat any single 2040 number with caution.
StakeMyGold is a gold platform. Holders of GGBR, a gold-backed token, can stake it to earn a return paid in gold; the site's FAQ states a target return that is not guaranteed and can change. GGBR is backed by certificates for gold still in the ground rather than vaulted bars, which we explain in what actually backs your token. It offers no silver product. Tokenized silver does exist elsewhere, but it is a much smaller market than tokenized gold, and we have not reviewed those products here.
When might gold yield suit someone better than silver? If your goal is steady exposure to precious metals with income, and you do not want silver's swings (it fell more than 50% from its January 2026 record close to its October low), staked gold is a different tool. Whether gold itself has earned its place is covered in is gold a good investment. Staking still carries real risks: smart contract risk, counterparty risk with lending partners, and liquidity limits in stressed markets. See is gold staking safe and how much you can earn staking gold. If you specifically want silver's upside in a bull case, a gold product will not give you that, and you should not use one as a substitute.
What is a realistic silver price prediction for 2030? A realistic base case is $70 to $85 an ounce. It assumes gold at $5,000 to $5,500 and a gold-silver ratio of 65 to 70. The bull case ($140 to $155) needs gold near $7,000 and a ratio near 45 to 50. The bear case ($45 to $50) assumes gold near $4,000 and a ratio of 80 to 90. We found no major bank with a dated 2030 silver forecast.
Could silver hit $500 an ounce? Not plausibly by 2030. $500 silver needs gold at $7,000 with a gold-silver ratio of 14, the 1980 low. At the ratio of about 73 in mid-October 2026, it would need gold at $36,500. Prices that high would also push solar makers to drop silver for copper.
Could silver reach $1,000 an ounce? Only if gold reached at least $14,000 and the ratio fell to its 1980 extreme. Neither appears in any published bank or institutional outlook we found.
How high will silver go in the next 10 years? Nobody can give a reliable figure. Using the ratio method, gold compounding at 5% a year and a ratio of 60 to 80 imply roughly $80 to $110 by 2035 and $103 to $138 by 2040. The range is wide because both inputs are uncertain.
What is the silver price forecast for 2026? Most dated forecasts put the 2026 average near $70. J.P. Morgan forecasts $70.60, with Q4 at $63. Metals Focus expects $72.60, HSBC $75 and the World Bank about $70. UBS targets $70 by December. Silver closed at $57.00 on 16 October 2026, below all of them.
Will silver outperform gold to 2030? Only if the gold-silver ratio falls from its mid-October 2026 level of about 73. J.P. Morgan expects about 75 in 2027, while UBS sees limited room above 70 and Metals Focus's forecasts imply about 63. Silver beats gold only in the scenarios where the ratio falls, which is our bull case.
The best-supported silver price prediction for 2030 is a range, not a single number: $70 to $85 in the base case, with $45 and $155 as the outer bounds under stated assumptions. The dated forecasts that exist stop at 2027 and run from the low $60s to the mid $80s, while silver itself sits near $57. Watch three things: what gold does, whether the gold-silver ratio drifts toward 60 or 80, and how fast solar replaces silver with copper. A forecast that ignores all three, including any figure in the hundreds or thousands, is extending a chart, not analyzing the market.
This article is for informational purposes only and is not financial advice.
