On 5 November 2026, Goldman Sachs cut its end-2027 gold forecast to $4,800 an ounce from $5,400, blaming a Federal Reserve that is raising rates again. Five days later, October inflation came in hotter than expected and gold fell about 2% after the release. On 11 November, COMEX gold futures closed at $4,000.50, almost exactly on the $4,000 line.
That is where any gold price prediction for 2027 has to start: about 25% below January's record close, with the Fed tightening and central banks still buying.
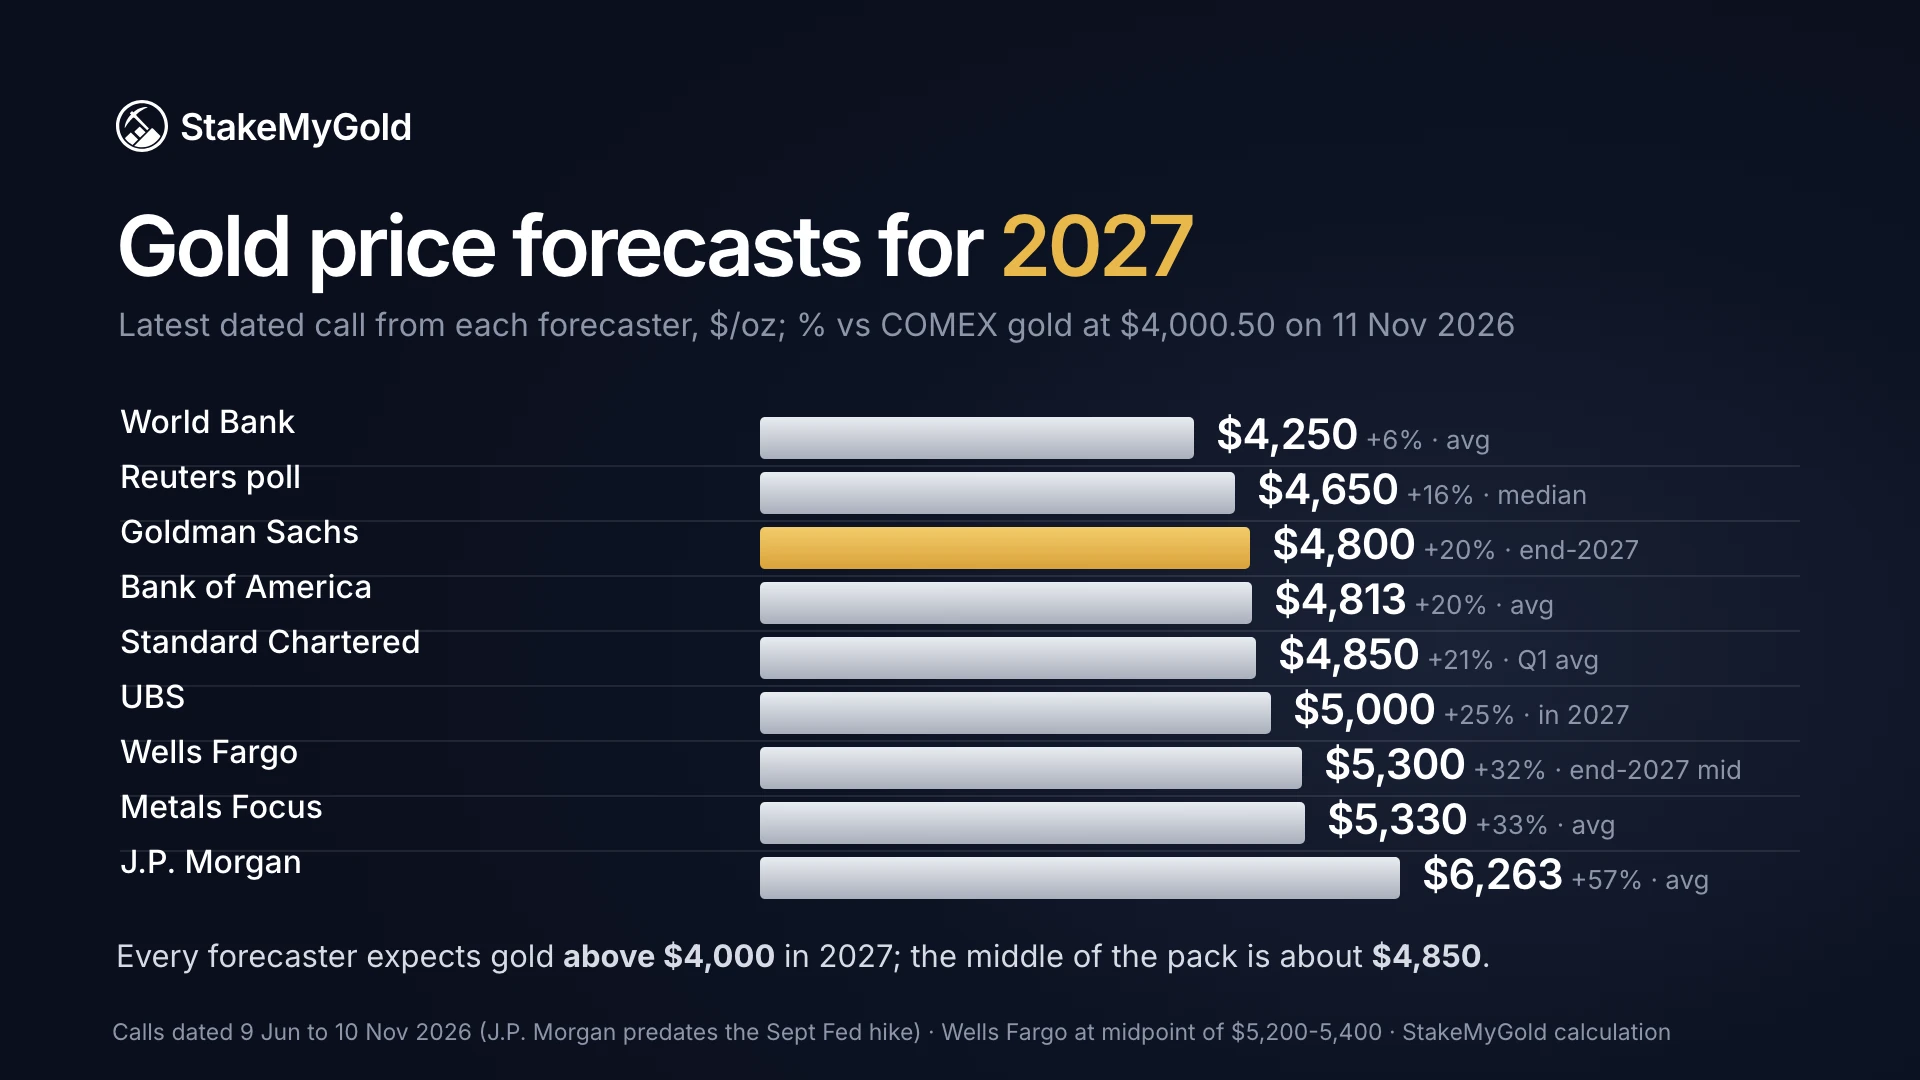
Short answer: the nine dated 2027 forecasts we could verify run from a $4,250 average (World Bank) to $6,300 in the fourth quarter (J.P. Morgan, set in June, before the Fed's September hike). The middle of the pack is about $4,850. Our base case for the end of 2027 is $4,500 to $5,000, with a bear case of $3,500 to $3,900 and a bull case of $5,400 to $6,300. Each case comes with its assumptions below, so you can check them as 2027 unfolds.
Gold is near $4,000 an ounce, down about 8% this year after one of the sharpest rises and falls in its history. All figures below are COMEX gold futures closes.
The fall came from rising rates, a stronger dollar and an oil shock tied to the conflict with Iran. We covered it in why gold is falling in 2026, and whether the January peak was a bubble in is gold in a bubble.
Banks and research firms expect gold to average or end 2027 between $4,250 and $6,300 an ounce, and most of the latest calls cluster between $4,650 and $5,000. The table lists every 2027 gold forecast we could tie to a named institution and a date. Read the "type" column carefully: an annual average, a year-end target and a quarterly figure are three different things.
Each figure links to the bank's research page or to a named news report of its note below; all re-checked on 12 November 2026. Percentages are our calculation.
The sources, newest first:
| Institution | Date of call | 2027 forecast | Type | vs $4,000.50 |
|---|
| Standard Chartered | 10 Nov 2026 | $4,850 | Q1 2027 average | +21% |
| UBS Global Wealth Management | 6 Nov 2026 | $5,000 or higher | During 2027 | +25% |
| Goldman Sachs | 5 Nov 2026 | $4,800 (downside case $4,660) | End-2027 | +20% |
| World Bank | Oct 2026 | $4,250 | 2027 average | +6% |
| Reuters poll of 30 analysts | 27 Oct 2026 | about $4,650 | 2027 average, median | +16% |
| Metals Focus | 19 Oct 2026 | $5,330 (Q4: $5,600) | 2027 average | +33% |
| Bank of America | 30 Sep 2026 | $4,813 (Q2 and Q3: $5,000) | 2027 average | +20% |
| Wells Fargo Investment Institute | 29 Sep 2026 | $5,200 to $5,400 | End-2027 | +30% to +35% |
| J.P. Morgan | 9 Jun 2026 | $6,263 (Q4: $6,300) | 2027 average | +57% |
They disagree mainly about the Fed. Forecasters who expect rate cuts to start in 2027 (UBS, Metals Focus, J.P. Morgan in June) sit at $5,000 and above. Those who expect rates to stay high all year (Standard Chartered, the World Bank) sit closer to $4,250 to $4,850. Almost all of them assume central banks keep buying. The question is whether that buying can outweigh higher rates.
Some figures you may see elsewhere are left out. We could not confirm an ING forecast of $4,375 for 2027 against any ING publication or named news report, and Citi's 2027 scenarios circulate in several undated, conflicting versions.
Not very. The same banks set their 2026 targets during a rally and have spent the year cutting them. That does not make their 2027 numbers useless, but it shows how far a one-year forecast can miss.
| Forecaster | Earlier 2026 call | Later cut | What happened |
|---|---|---|---|
| J.P. Morgan | Q4 2026 average $6,300; 2026 average $5,708 (Feb 2026) | $6,000 and $5,243 (Jun 2026) | Q4 average so far about $4,100 |
| UBS | End-2026 $5,900 | $5,500 in May | $4,000.50 on 11 Nov |
| Goldman Sachs | End-2026 $4,900 in June | $4,650, then $4,150 (Nov) | $4,000.50 on 11 Nov |
| Bank of America | 2026 average about $5,070 | Cut 14% to $4,360 in July | 2026 average so far about $4,500 |
Bank of America's earlier figure is implied by the 14% cut. Gold averages are our calculation from COMEX closes to 11 November.
In May, UBS's analysts summed up what went wrong: "Markets are rediscovering the concept of opportunity cost." Opportunity cost is what you give up by holding one asset instead of another. Gold pays no interest, so when bonds pay more, holding gold costs more.
Five forces will decide where gold ends 2027: the Fed's next moves, real interest rates, central bank buying, ETF flows, and the dollar and oil. The first two move together, and they are the ones forecasters disagree about most.
The Fed raised its policy rate in September for the first time since 2023 and held it at 3.75% to 4.00% on 28 October, with two officials voting for another hike. Before the hot October inflation report, futures markets priced a December hike at close to 80%.
For 2027, the key question is when cuts begin. Goldman's economists expect them from late 2027. Standard Chartered expects none in 2027. A hike in March 2027 is Goldman's downside case. Our analysis of what happens to gold when interest rates rise shows gold's reaction has varied a lot across past Fed cycles.
A real yield is the interest rate on a bond after inflation. The 10-year version comes from US Treasury Inflation-Protected Securities (TIPS). It went from 1.93% at the end of 2025 to 2.66% on 9 November 2026, a big move for this measure. The ordinary 10-year Treasury yield closed at 5.00% on 11 November.
Higher real yields make an asset with no income less attractive. If real yields fall back toward 2% in 2027, that would support the bull case. If they climb toward 3%, the bear case gets closer.
Central banks bought a net 321 tonnes of gold in the third quarter of 2026, 42% more than a year earlier, according to the World Gold Council. Goldman assumes about 60 tonnes a month through 2027, against a pre-2022 average of 17. That assumption drives most of its expected rise to $4,800.
This buying is why most forecasters see support near $4,000. If it slows sharply, that support weakens. Our piece on how central banks have bought gold at a record pace explains who is buying and why.
A gold ETF is a fund that trades on a stock exchange and holds physical gold for its investors. ETFs added 211 tonnes in the third quarter and reached record holdings of 4,256 tonnes, the World Gold Council reported, and Standard Chartered counted another 19 tonnes in October. ETF investors tend to sell when rates rise. J.P. Morgan warned in June that a Fed hiking cycle could bring "more sustained Western ETF outflows".
Gold is priced in dollars, so a stronger dollar usually weighs on it. The ICE dollar index closed at 102.91 on 11 November. Oil matters because high oil feeds inflation, which keeps the Fed hiking. Bank of America estimates that if oil reached $150 a barrel, gold would average about $3,500 in 2027. The bank does not treat that as its main case.
Our gold price prediction for 2027 is a range for the end of the year, built from the forecasts above and the five drivers. The cases are not probabilities. They show which assumptions lead to which prices.
| Case | End-2027 range | Change from $4,000.50 | Forecasters nearby |
|---|---|---|---|
| Bear | $3,500 to $3,900 | -13% to -3% | Bank of America's $150-oil case; World Bank's $4,000 for 2028 |
| Base | $4,500 to $5,000 | +12% to +25% | Reuters poll, Goldman, Bank of America, Standard Chartered, UBS |
| Bull | $5,400 to $6,300 | +35% to +57% | Wells Fargo, Metals Focus (Q4), J.P. Morgan (June) |
Worked example. Say you put $10,000 into gold at the 11 November close of $4,000.50. That buys just under 2.5 ounces. At the end of 2027, those ounces would be worth about $8,750 to $9,750 in the bear case, $11,250 to $12,500 in the base case, and $13,500 to $15,750 in the bull case. Dealer premiums, storage costs and taxes would reduce each figure. In the US, gains on bullion are taxed as a collectible, at a maximum 28% rate.
How often has gold moved this much? We measured every 12-month change in COMEX gold from August 2000 to November 2026, 6,322 windows in all. Gold rose 12.5% to 25% (the base case range) in 23% of them, rose more than 33% (enough for a new record from here) in 13%, and fell more than 2.5% (the bear case) in 20%. Those years include the long bull market of the 2000s, so the history leans upward.
The dates that matter most for gold in 2027 are the eight Fed meetings, especially the four with new rate projections. The table lines them up with the forecasts you can check against.
| Quarter | Key dates | Forecast checkpoints | What would change the picture |
|---|---|---|---|
| Before 2027 | Fed decision 9 Dec 2026 | Standard Chartered: Q4 2026 average $4,650 | A 50-point hike instead of 25, which some Fed officials have backed |
| Q1 2027 | Fed meetings 26-27 Jan and 16-17 Mar | Standard Chartered: Q1 average $4,850 | A March hike (Goldman's downside case) |
| Q2 2027 | Fed meetings 27-28 Apr and 8-9 Jun | Bank of America: Q2 average $5,000; UBS: $5,000 | First signs of a cut in the June projections |
| Q3 2027 | Fed meetings 27-28 Jul and 14-15 Sep | Bank of America: Q3 average $5,000 | The first cut, if Goldman's economists are right |
| Q4 2027 | Fed meetings 26-27 Oct and 7-8 Dec | Goldman $4,800; Wells Fargo $5,200 to $5,400; Metals Focus Q4 $5,600 | Whether a record above $5,318 is in reach |
Fed dates from the FOMC calendar, tentative until confirmed at the prior meeting. The March, June, September and December meetings include new economic projections.
Two more data points arrive each quarter: the World Gold Council's Gold Demand Trends report, with central bank and ETF tonnes, and the monthly US inflation report. If central bank buying in those reports drops well below Goldman's 60 tonnes a month, the base case is at risk.
Every forecaster we found expects it to, but they disagree on how much. The latest calls range from 6% (World Bank) to 35% (Wells Fargo), plus J.P. Morgan's June call of 57%. The main risk to that view is a Fed that keeps hiking into 2027. If you hold gold for the long run, the year-by-year path matters less than the trend; our gold price prediction 2030 covers the longer horizon, and how much gold to own looks at sizing a position after this year's drop. Silver usually moves further than gold in both directions; our silver price prediction 2030 builds its cases from the gold-silver ratio.
StakeMyGold does not forecast gold and cannot change what the price does in 2027. Holders of GGBR, a gold-backed token, can stake it to earn a return paid in gold. The FAQ states that the target return is not guaranteed and can change. GGBR is backed by certificates for gold still in the ground, not vaulted bars, which we explain in what actually backs your token.
For someone who already plans to hold gold through 2027, staking is one way to earn on it while waiting. It does not protect you in the bear case: if gold falls 13%, a staked ounce falls 13% too. Staking adds its own risks, including smart contract and counterparty risk, set out in is gold staking safe.
What is the gold price prediction for 2027? The nine dated forecasts we verified range from a $4,250 average (World Bank) to a $6,300 fourth-quarter average (J.P. Morgan, set in June). The middle of the range is about $4,850. Our base case for the end of 2027 is $4,500 to $5,000, from a price of $4,000.50 on 11 November 2026.
What is Goldman Sachs' gold forecast for 2027? Goldman expects gold at $4,800 an ounce at the end of 2027, cut on 5 November 2026 from $5,400. Its downside case is $4,660 if the Fed hikes again in March 2027 or delays cuts. It expects central banks to buy about 60 tonnes a month.
Will gold go down in 2027? None of the forecasters we found expect a lower average than today's price. A fall is still possible. Bank of America estimates gold would average about $3,500 in 2027 if oil reached $150 a barrel. Since 2000, gold has fallen more than 2.5% in about 20% of 12-month periods.
Will gold hit a new record in 2027? It would need to rise about 33% to pass the $5,318.40 record close of 29 January 2026. Metals Focus, Wells Fargo and J.P. Morgan's June forecast see that as possible by late 2027. Since 2000, gold has gained 33% or more in about 13% of 12-month periods.
Will gold hit $10,000 an ounce in 2027? No forecast we found comes close. $10,000 is 150% above the 11 November 2026 close. The biggest 12-month gain since 2000 was about 92%, from January 2025 to January 2026.
Should I sell my gold or hold it in 2027? That depends on why you own it, your time horizon and your taxes, not on a one-year forecast. Forecasters missed 2026 by a wide margin. If you are unsure, a licensed financial adviser can look at your full situation.
The best-supported gold price prediction for 2027 is a range: $4,500 to $5,000 by the end of the year in the base case, with $3,500 and $6,300 as the outer bounds under stated assumptions. Every forecaster we found expects gold above today's $4,000, but they have been cutting their numbers all year as the Fed turned to hiking. Watch three things in 2027: when the Fed starts cutting, whether real yields fall from 2.66%, and whether central banks keep buying near 60 tonnes a month.
This article is for informational purposes only and is not financial advice.
