On Friday, 30 October 2026, COMEX gold futures closed at $3,898.90 an ounce, and Kitco reported that gold had fallen to a one-year low below $3,900. That is 26.7% below the record close of $5,318.40 set on 29 January. Nine months after the peak, the question people typed into Google in January is back with a new edge: was that a gold bubble, and is this what a bubble bursting looks like?
Most answers to "is gold in a bubble?" online are opinions written before the peak. This one runs five tests you can check yourself, on public data from the World Bank, the US Bureau of Labor Statistics (BLS), the Commodity Futures Trading Commission (CFTC) and the World Gold Council (WGC).
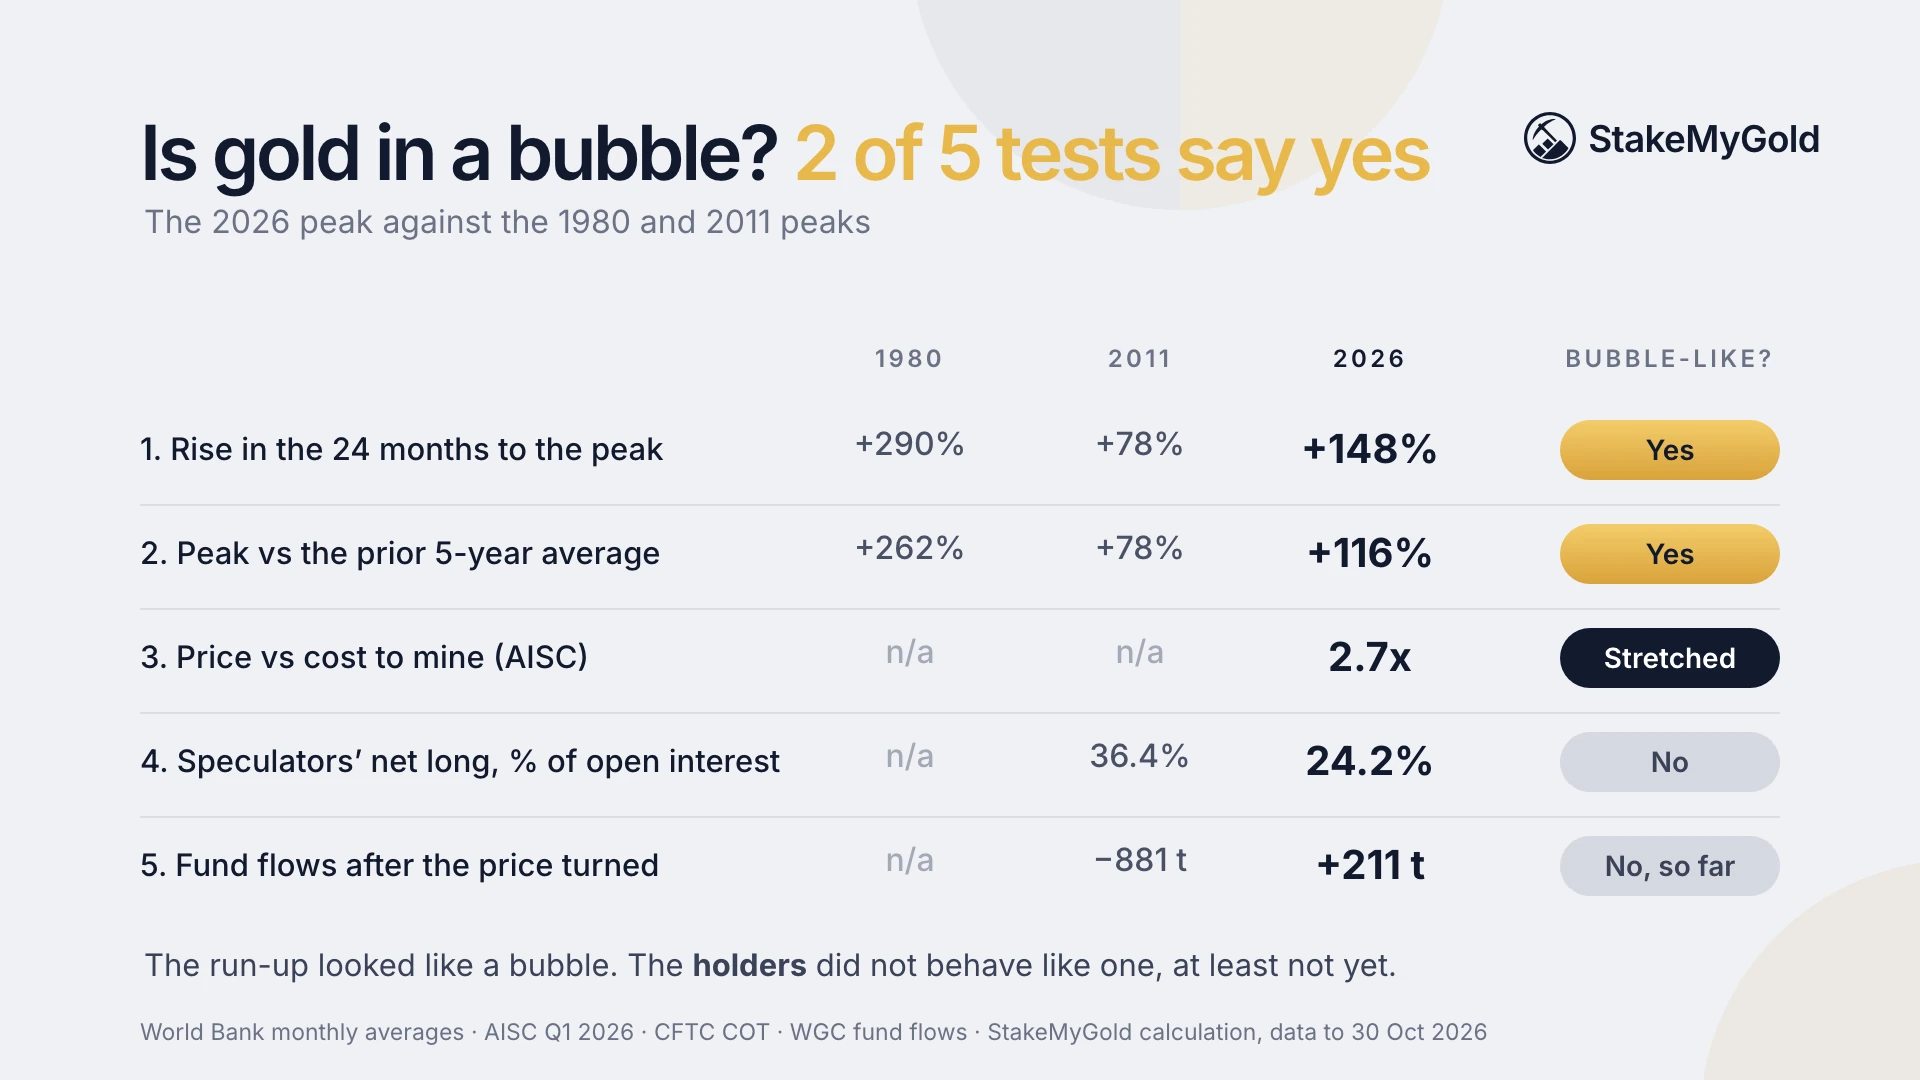
The short answer: the 2026 rally failed two of the five tests. It was the fastest run-up since 1980 and the most stretched above its own trend since at least 2001. It passed the other three: speculators were not crowded at the top, and fund buyers came back after the fall instead of running. Gold is still far above every earlier peak after inflation, so it is not cheap. A bubble can only be confirmed afterwards, and the data so far does not show a burst like 1980 or 2013.
A gold bubble is a stretch of time when the gold price climbs far above what its demand and costs can justify, mainly because buyers expect it to keep climbing. When that expectation breaks, the price falls hard and stays down for years.
Gold makes this hard to judge. A stock has profits and a bond has interest, so you can compare the price with the cash it pays. Gold pays nothing. There is no agreed "fair value", so nobody can point to a number and say the price is X% too high.
What you can do is look for the symptoms that past bubbles shared. Gold's two famous peaks, January 1980 and September 2011, both had them:
The five tests below check each one for 2026, and compare it with 1980 and 2011.
Here is the scorecard. Each test is explained underneath, with the numbers and where they come from.
Tests 1 and 2 use World Bank monthly average prices (peak months: Jan 1980, Sep 2011, Feb 2026). The data behind tests 3 to 5 does not reach back to 1980, and AISC starts in 2012. Own calculations, data to 30 Oct 2026.
Fast enough to count as a bubble symptom. In the World Bank's monthly price series, gold averaged $5,020 an ounce in February 2026, its highest month. That was 148% above the average 24 months earlier, and 136% above it after US inflation.
For comparison, gold rose 290% in the 24 months to January 1980 and 78% in the 24 months to September 2011. So 2026 sits between the two famous peaks: not as wild as 1980, almost twice as fast as 2011.
Speed alone does not prove a bubble. Prices can jump because something real changed. It is a warning sign, not a verdict.
Further than any time this century. At its February 2026 monthly peak, gold was 116% above its average of the previous five years. Before the 1980 top the gap was 262%, and before the 2011 top it was 78%.
Daily data shows the same thing more sharply. On 29 January 2026 the record close of $5,318.40 sat 40.5% above its own 200-day moving average (the average close of the previous 200 trading days). In COMEX futures data, that is the widest gap since at least 2001. At the 22 August 2011 record close, the gap was 28.3%. By 30 October 2026, the price was 13.7% below its 200-day average.
A price this far above its own trend usually comes back toward it. In 2026, it has.
Stretched, though costs are rising too. Miners report an all-in sustaining cost (AISC), the full cost of producing an ounce from an existing mine, including royalties, overheads and the capital needed to keep it running. In Q1 2026, the industry average AISC was $1,785 an ounce, a record, and the average margin over that cost was a record $3,076, according to Metals Focus data published by the WGC.
| Test | 1980 peak | 2011 peak | 2026 peak | Looks like a bubble in 2026? |
|---|
| 1. Rise in the 24 months to the peak | +290% | +78% | +148% | Yes |
| 2. Peak vs the prior 5-year average | +262% | +78% | +116% | Yes |
| 3. Price vs mining cost (AISC) | no data | no data | 2.7x (Q1 2026) | Stretched |
| 4. Speculators' net long, % of open interest | no data | 36.4% | 24.2% | No |
| 5. Fund flows after the price turned | no data | -881 t (2013) | +211 t (Q3 2026) | No, so far |
That puts the Q1 2026 gold price at about 2.7 times what it cost to produce. In Q1 2022, the AISC was $1,232 with a margin of $646, so the price was about 1.5 times cost. The same WGC note says margins averaged $338 an ounce from 2012 to 2019. The Q1 2026 margin was about nine times that.
Two things soften this result. Costs keep climbing, with royalties, fuel and freight all up in 2026, so the gap narrows from both sides. And the cost of mining sets a rough floor under the price over many years, not a ceiling. Gold has traded far above cost for long periods before.
No. This is the clearest result against a bubble. Every week the CFTC publishes the Commitments of Traders report, which shows how traders are positioned in COMEX gold futures. The group to watch is managed money: hedge funds and commodity trading advisers, the fastest-moving speculative money.
In the report for 27 January 2026, two days before the record, managed money held a net long of 118,159 contracts, or 24.2% of all open contracts. That is about the median since the data starts in 2006. In the report for 23 August 2011, the day after that year's record, it was 36.4%. The highest reading was 45.6% in September 2016, when there was no bubble at all.
Bubbles usually end with speculators crowded into the same bet. In January 2026 they were not. As of 27 October 2026 the reading was 26.6%, still close to normal.
Not so far. After the 2011 peak, the bust came in 2013, when investors redeemed 881 tonnes from gold ETFs in one year, according to the WGC.
2026 looks different. Gold ETFs (exchange-traded funds that hold bullion for their shareholders) lost 44.8 tonnes in Q2 2026 as prices fell, while central banks bought 288.9 tonnes the same quarter. Then in Q3, global gold ETFs took in a record $31 billion and 211 tonnes, lifting holdings to a record 4,256 tonnes at the end of September. That happened even though the Federal Reserve raised rates in September.
October's flow data is not out yet, and October is when the price broke below $4,000. This test can still change.
The two earlier peaks show what a gold price crash looks like after a real bubble, and how long the damage lasted. All prices below are monthly averages, with inflation-adjusted figures in September 2026 dollars using the BLS consumer price index.
| 1980 | 2011 | 2026 (so far) | |
|---|---|---|---|
| Peak month | Jan 1980 | Sep 2011 | Feb 2026 |
| Peak monthly average | $675 | $1,772 | $5,020 |
| Peak in Sep 2026 dollars | $2,923 | $2,631 | $5,176 |
| Change 7 months after the peak | -7% | -7% | -14% |
| Lowest monthly average | $256 (Jul 1999) | $1,076 (Dec 2015) | $4,073 (Jul 2026) |
| Deepest fall, monthly | -62% | -39% | -19% |
| Back above the peak (nominal) | May 2006, 26 years later | Jul 2020, 9 years later | not yet |
| Back above the peak (after inflation) | Feb 2025, 45 years later | Aug 2024, 13 years later | not yet |
Own calculations from World Bank monthly prices and BLS CPI-U. Daily closes fell further: 26.7% from 29 Jan to 30 Oct 2026.
Two points stand out. First, the 2026 fall has been quicker than the first seven months after either earlier peak. Second, the real damage in 1980 and 2011 came later. Gold took four years to hit bottom after 2011 and almost two decades after 1980. Seven months tells you little about which path 2026 is on.
Say you put $10,000 into gold at the record close of $5,318.40 on 29 January 2026. That bought about 1.88 ounces.
This is why the bubble question matters most for people who bought near the top. For someone who has held gold for ten years, the 2026 fall cuts into large gains. Our look at 55 years of gold returns, crashes and recoveries shows how much the entry point decides the outcome.
By history, yes. By today's demand, it is less clear. After inflation, the 30 October close was 33% above the January 1980 peak and 48% above the September 2011 peak. Gold has never spent long this far above its old real highs. If you believe gold returns to its long-run average after inflation, it is still expensive.
The case against calling it overvalued rests on who is buying. Central banks bought 288.9 tonnes in Q2 2026 alone, while the price was falling. We cover that in what record central bank buying means for everyone else. If that demand is lasting, the old peaks are a weaker guide than they look.
What has pushed the price down this year is mostly rates, the dollar and oil, covered in why gold has fallen in 2026. That is a change in conditions, not proof that the earlier price was a bubble.
StakeMyGold lets you stake gold-backed tokens to earn a yield paid in gold. That changes one thing about owning gold: the metal no longer sits idle. It does not change the price risk. If gold falls 27%, a staked gold token falls 27% too, and the yield covers only a small part of a drop that size.
StakeMyGold also does not time the market for you, and it is not a hedge against a gold bubble. If you think gold is overvalued, the honest answer is to hold less of it, not to hold it on a different platform. If you plan to own gold anyway, read the risks most staking platforms leave out before you deposit.
Is gold in a bubble right now? The data does not show a bubble bursting as of October 2026. The 2026 rally rose fast and far above its trend, two bubble symptoms. But speculators were not crowded at the top, and ETF buyers added a record $31 billion in Q3 after the fall. Whether January 2026 was a bubble peak will only be clear in hindsight.
Will gold crash? Nobody can say. Gold fell 26.7% from its January 2026 record close to 30 October. After the 1980 and 2011 peaks, gold fell 62% and 39% on monthly averages, over several years. Those are history, not a forecast.
Will gold hit $10,000 an ounce? That would take a rise of about 156% from the 30 October close of $3,898.90. Gold has done that before over a few years, but no data in this article supports a forecast either way.
What was the 1980 gold bubble? Gold rose 290% in the 24 months to January 1980, a period when US consumer prices rose 13% in a single year, then fell 62% on monthly averages by 1999. It took until 2006 to pass the 1980 peak in dollars, and until 2025 after inflation.
Why did gold fall in 2026? Mainly higher interest rates, a stronger dollar and an oil shock, after a record run in January. The Federal Reserve raised rates in September 2026. Higher rates make gold, which pays no interest, less attractive next to bonds and cash.
Run against the data, the 2026 gold rally looks half like a bubble. It rose faster than at any time since 1980 and climbed further above its own trend than at any point this century. But the speculative crowding and the investor flight that marked earlier busts are missing so far. Gold is still well above its old peaks after inflation, so it is not cheap. If you buy now, do it with money you can leave alone for years, in an amount that would not hurt if 1980 or 2011 repeated.
This article is for informational purposes only and is not financial advice.
